

WEEK ENDING 1/12/2024
- Treasury curve continues to steepen.
- Noisy CPI numbers for December; dovish PPI.
- What could go wrong in the economy?
- Municipal bonds heading into a challenging environment.
A CITY DIFFERENT TAKE
The 2-10 spread finished the week at -0.21%. You can gauge the steepening of the curve by studying the metrics for the beginning of the year, which is merely a two-week data period. The year started with this spread at -0.37%. The economic data so far this week has caused the 10-year yield to go up by a few basis points. It caused a reverse for the 2-year that has gone a little lower in yield. In March of 2023 (around the same period as the regional banking crisis), this spread was looming at -1.08%.
The data out in the first two weeks of 2024 can be summarized in the following points:
- Nonfarm payrolls exceeded expectations, while unemployment was lower than expected.
- Core CPI came in higher than expected. Core CPI stood at 3.9% for December. (Again, context here is important. Annual CPI was at 7.2% in 2021.) Also, note that Core PCE is the Fed’s favorite measure of inflation.
- PPI was lower than expected for December. PPI year-over-year stands at 1% and fell by 0.1% for December.
In other news, we were visiting with advisors last week, and one of the questions we got was “What could go wrong with the economy”? We seem poised for a soft landing. After all, the economy looks strong in the form of the labor market, and inflation prints are coming down. Remember last year when every analyst was obsessed with predictions and probabilities of a hard landing, a soft landing, and no landing? The same saga continues with high market probability and pricing for soft or no landing.
- The labor market continues to be an important driver. Job growth is slowing, and unemployment has ticked up marginally. If this momentum picks up, this would be a negative for growth.
- Keep a close eye on credit card debt and delinquencies. It is a trend that is worth watching. Remember, personal consumption is 70% of GDP.
- Supply chain disruption could rear its head back again if the Red Sea geopolitical risk continues. Longer routes add to both delays and costs. What does this mean? Inflation that has been trending in the right direction can linger for longer and could even rise. Preventing inflation resurgence is a real worry for the Federal Reserve.
CHANGES IN RATES
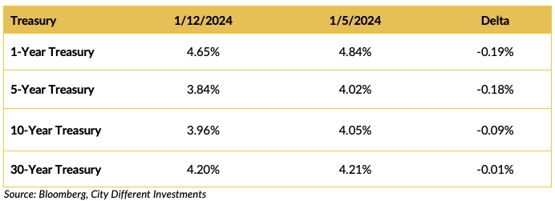
The rally in Treasury yields continued after a respite at the beginning of the new year. The rally was asymmetric, with short rates decreasing more than long rates. The slope of the Treasury curve became less inverted. The 2-10 spread finished the week at -0.21%. The opportunity to fight the “cash trap” (the reinvestment risk of owning money market funds, for example) is reducing as the yield curve steepens, led by moves in the front end of the curve.
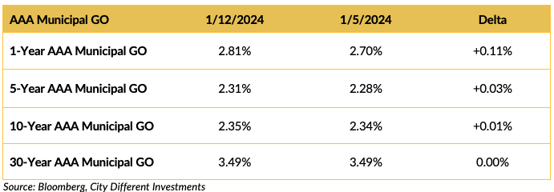
The municipal market did not follow the moves in the Treasury market. This is due to the “January Effect,” which we will probably be talking about until the end of February. The January Effect has led to higher valuations of municipal bonds versus their Treasury equivalents. As the “January Effect” continues, the next question is, “When will it subside?”
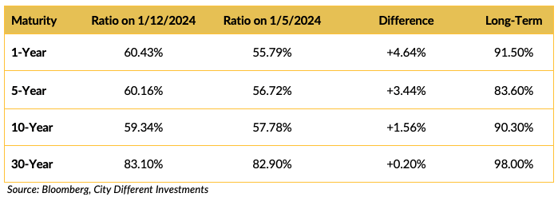
The municipal market outperformed in December with a rally in prices. The muni outperformance has resulted in rich valuations as you can see below. The municipal/Treasury ratios increased (municipal bonds became less expensive) during the week. They are still past the breakeven rate compared to their Treasury equivalents. The calendar for muni issuers looks interesting, with a sizeable supply picture.
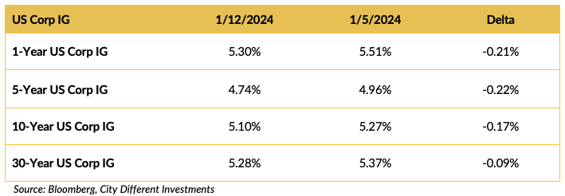
Corporate yields followed Treasuries lower last week, led by the short end of the yield curve. The past week's U.S. investment grade market saw 34 issuers price a massive $44.3 billion across 60 tranches as borrowers rushed to capitalize on rate stability and investor appetite ahead of inflation data and the start of earnings blackouts.
THIS WEEK IN WASHINGTON
.png?width=1920&name=graphs%20in%20order%20(1).png)
At the time of this writing, Iowa Caucus voting is commencing with frigid weather conditions. This officially kicks off the fight for the 2024 Republican presidential nomination. Former President Trump still leads the pack by a significant margin while Nikki Haley and Gov. Ron DeSantis fight for second place.
“A Des Moines Register/NBC News/Mediacom Iowa Poll released Saturday evening showed Trump with 48% of likely voter support, but Haley supplanted DeSantis as runner-up at 20%. DeSantis was at 16%.” -Source Bloomberg
*Editor’s Note — Trump won Iowa by a significant margin, collecting 20 delegates, while DeSantis won 8 and Haley won 7. Vivek Ramaswamy suspended his presidential campaign.
What do these results mean for the GOP presidential race? It appears a lot depends on what happens in New Hampshire.
Meanwhile, in another corner of the world, Taiwan's election results and the victory of Taiwan’s ruling Democratic Progressive Party mean the status quo for the markets. We have not seen much reaction out of China yet. The U.S.-China-Taiwan relationship is important geopolitically with regard to global semiconductor markets.
WHAT, ME WORRY ABOUT INFLATION?
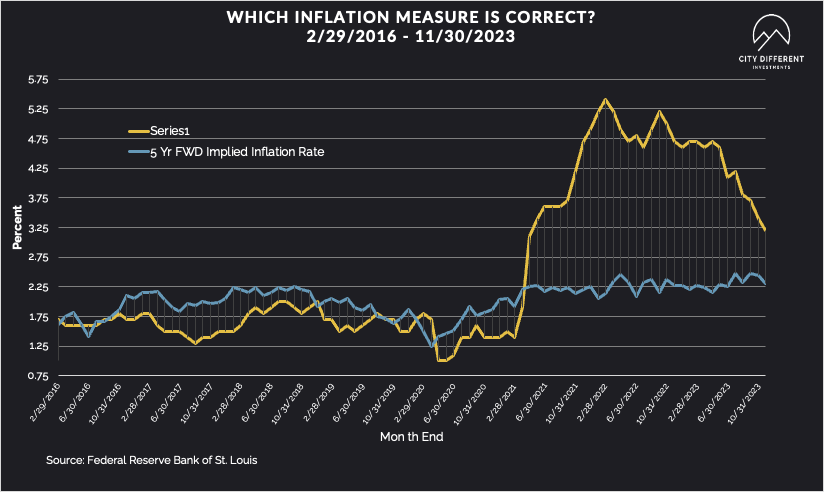
The 5-year Breakeven Inflation Rate finished the week of January 12 at 2.32%, seven basis points higher than the January 5 close of 2.25%. The 10-year Breakeven Inflation Rate finished the week at 2.27%, five basis points higher than the close of January 5.
MUNICIPAL CREDIT
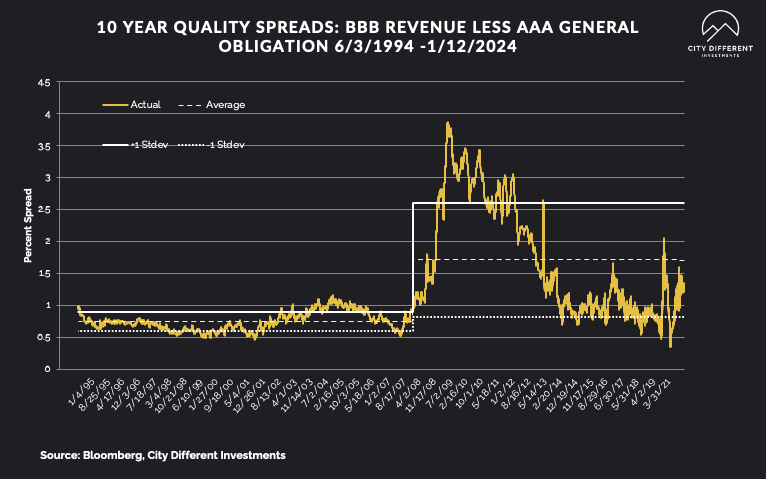
10-year quality spreads (AAA vs. BBB) as of January 12 were 1.21%, unchanged from January 5 (based on our calculations). The long-term average is 1.71%.
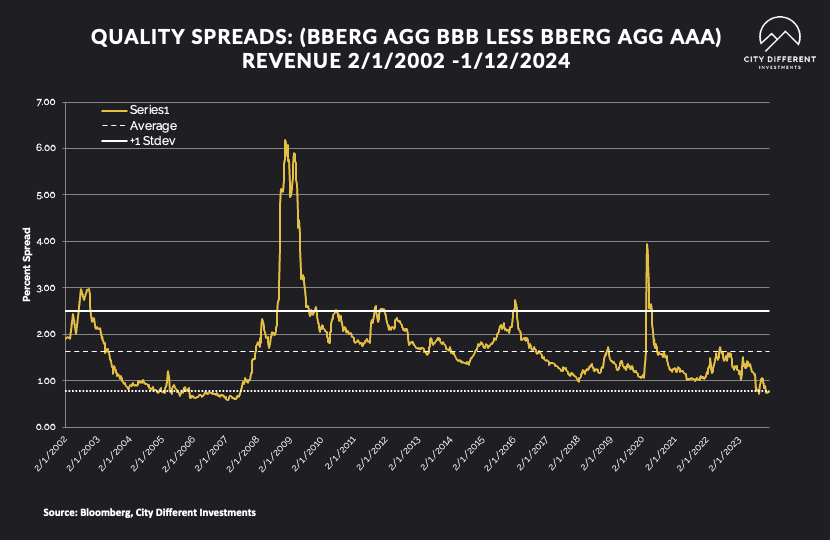
Quality spreads in the taxable market are not attractive but were unchanged (kind of), ending the week at 0.77%, one basis point wider than last week. High-yield quality spreads were 3.18% on January 12.
WHERE ARE FIXED-INCOME INVESTORS PUTTING THEIR CASH?
Money Market Flows (millions of dollars)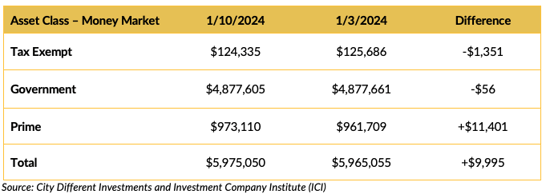
Money market funds are attracting significant assets. Beware the “Cash Trap”! If short term rates continue to decline, money market investors will be disappointed.
Mutual Fund Flows (millions of dollars)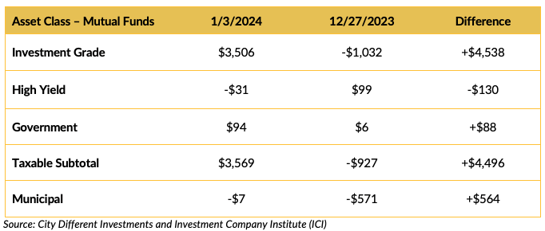
ETF Fund Flows (millions of dollars)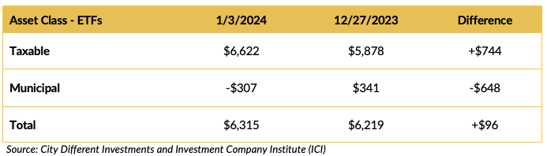
SUPPLY OF NEW ISSUE MUNICIPAL BONDS
Supply for the municipal tax-exempt calendar will remain uneven for the next few weeks. Estimates for this week’s municipal tax-exempt calendar only totals $6.5 billion in new issuance.
CONCLUSION
The year is in full swing, with the release of important economic indicators trending in the right direction. Supply pictures in both the tax-exempt and taxable markets look robust. The 2-10 yield spreads continue to steepen. The municipal picture for January looks to be challenging, with rich valuations and a big calendar working against each other. American politics is getting exciting with presidential primaries ahead of us.
IMPORTANT DISCLOSURES
The information and statistics contained in this report have been obtained from sources we believe to be reliable but cannot be guaranteed. Any projections, market outlooks or estimates presented herein are forward-looking statements and are based upon certain assumptions. Other events that were not taken into account may occur and may significantly affect the returns or performance of these investments. Any projections, outlooks or assumptions should not be construed to be indicative of the actual events which will occur. These projections, market outlooks or estimates are subject to change without notice.
Please remember that past performance may not be indicative of future results. Different types of investments involve varying degrees of risk, and there can be no assurance that the future performance of any specific investment, investment strategy, or product or any non-investment related content, made reference to directly or indirectly herein will be profitable, equal any corresponding indicated historical performance level(s), be suitable for your portfolio or individual situation, or prove successful. Due to various factors, including changing market conditions and/or applicable laws, the content may no longer be reflective of current opinions or positions.
All indexes are unmanaged, and you cannot invest directly in an index. Index returns do not include fees or expenses. Actual portfolio returns may vary due to the timing of portfolio inception and/or investor-imposed restrictions or guidelines. Actual investor portfolio returns would be reduced by any applicable investment advisory fees and other expenses incurred in the management of an advisory account.
You should not assume that any discussion or information contained herein serves as the receipt of, or as a substitute for, personalized investment advice from City Different Investments. To the extent that a reader has any questions regarding the applicability above to his/her individual situation or any specific issue discussed, he/she is encouraged to consult with the professional advisor of his/her choosing. City Different Investments is neither a law firm nor a certified public accounting firm and no portion of this content should be construed as legal or accounting advice.
A copy of City Different Investments' current written disclosure statement discussing our advisory services and fees is available for review upon request.
Unless otherwise noted, City Different Investments is the source of information presented herein.
A description of the indices mentioned herein are available upon request.