

WEEK ENDING 4/19/2024
- Resetting rate-cut expectations.
- 18 months of yield curve inversion.
- Will 10-year Treasury yields hit a 5% handle?
A CITY DIFFERENT TAKE
For a year that started with expectations of up to six rate cuts, we are now seeing that a rate hike might be on the table.
To be fair, the rate hike scenario must build up for the Fed to act. The FOMC might be frustrated that inflation is taking a while to come back to 2%. This came out in Chair Powell’s press conference where he announced that the Fed will need longer to gain confidence in inflation returning to its target.
After hot inflation data this month, his stand makes sense. It is a slight change, however, from his last remarks that the Fed will be lowering rates this year. The Fed is now in its blackout period leading up to their May 1 meeting. During this blackout, the Fed will get to see the prints from March PCE data and Q1 GDP numbers prior to their meeting.
The Treasury curve right now reflects a hawkish Federal Reserve with rates rallying in the last two weeks. 10-year Treasury yields for the last two weeks range between 4.55% and 4.70%. The inflation number currently at 3% compared to the Fed’s target rate of 2% and a current Fed funds rate of 5.3% points, all point to a moderately restrictive Fed policy. You can see this thesis supported in the U.S. economy, where GDP growth is close to 3% according to the Atlanta Fed. The market is pushing rate-cut probabilities further into the year, with the highest probability of a July cut for now.
With the Treasury curve flirting with a 10-year yield close to 5%, there is a natural debate in the market about the probability for the event. Events that could lead to a 5% handle for the 10-year would be:
- Even hotter inflation prints delaying rate expectations.
- Geopolitical tensions rising from the Middle East, Russia, and China.
- High budget deficit issuance resulting in a lack of term premium.
Every bond trader worth their time in their seat was taught that a 2-year and 10-year Treasury curve inversion points to a recession. Curve inversion refers to the short-term rates (2-year) being higher than the long-term rates (10-year). The yield curve has been inverted now for a year and half. Many calls for recession have been dashed at the altar of a hot labor market and 3% GDP growth for the economy.
According to Chris Low, chief economist at FHN Financial, we saw similar periods of protracted curve inversion in the ‘60s and ‘70s. The reasoning behind those inversions was the long end of the curve was not restrictive enough. Moving on to the ‘80s up until 2020, the blips of inversion were derived from excessive tightening by the Fed to cool down the economy.
CHANGES IN RATES
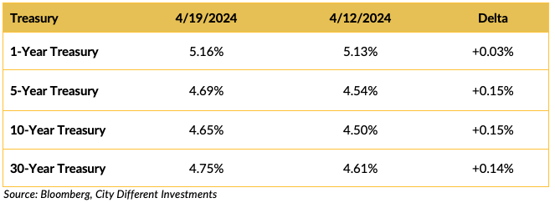
Treasury rates moved higher on the week. The yield rally continues in a big way where the belly and the long end of the curve rallied by 15 basis points.
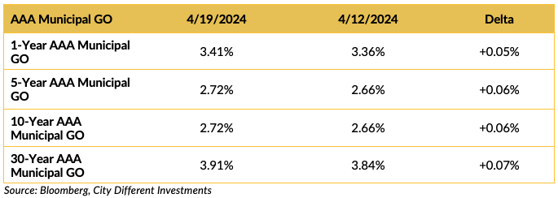
The municipal market’s yields moved higher on the week (but only slightly compared to the Treasury market’s moves). Muni rates are lagging (compared to Treasury rates) and we are hoping that they catch up a bit to the massive move in Treasury market.
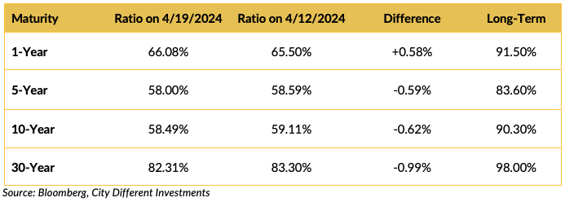
The municipal/Treasury ratios increased in the short part of the curve (1-5 year) and decreased in the 10-year and 30-year tenors.
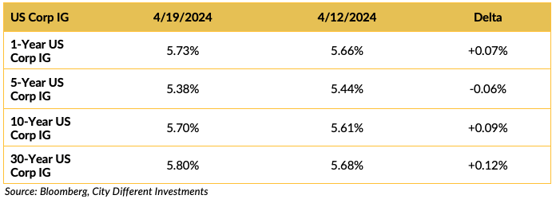
The credit market followed the Treasury market to a lesser degree with rates rallying in various parts of the curve.
THIS WEEK IN WASHINGTON
.png?width=1920&name=graphs%20in%20order%20(1).png)
The House finally passed its $95 billion foreign aid package this Saturday. The bill takes care of funding for Ukraine, Israel, and Taiwan. Ukraine gets the big chunk of the funding at $60 billion while another $26 billion goes to Israel. The remaining $8 billion will go to Taiwan.
It was a contentious bill with Speaker Johnson’s political career on the line. His opposition was driven by Rep. Greene and her supporters that wanted the funding to go to U.S. borders.
Lack of military escalation and a quiet Middle East is a relief on the geopolitical stage.
WHAT, ME WORRY ABOUT INFLATION?
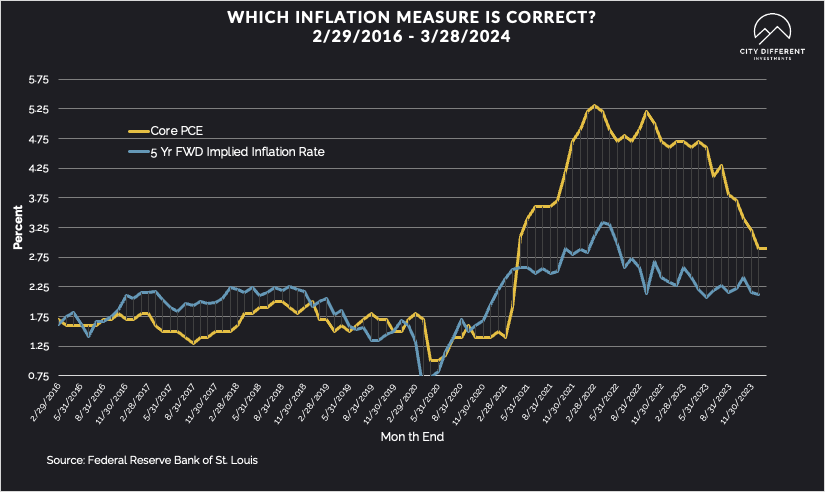
The 5-year Breakeven Inflation Rate finished the week of April 19 at 2.44%, three basis points lower than the April 12 close of 2.47%. The 10-year Breakeven Inflation Rate finished the week at 2.41%, three basis points higher than the close of April 12.
MUNICIPAL CREDIT
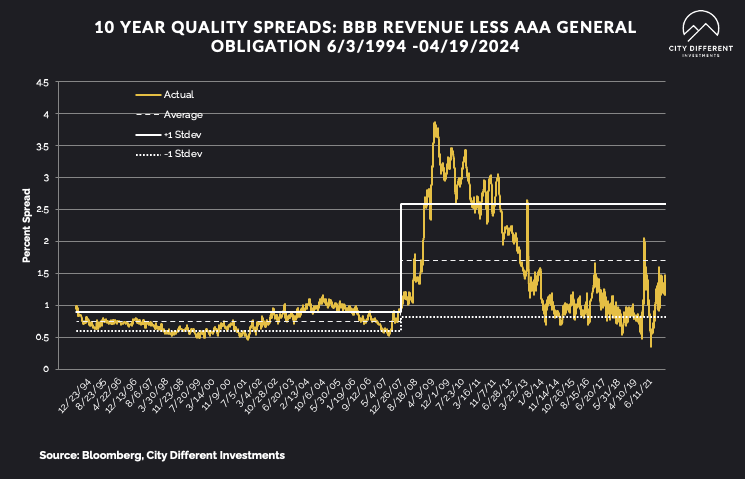
10-year quality spreads (AAA vs. BBB) as of April 19 were 1.19%, two basis points higher than the April 12 reading of 1.17% (based on our calculations). The long-term average is 1.70%.
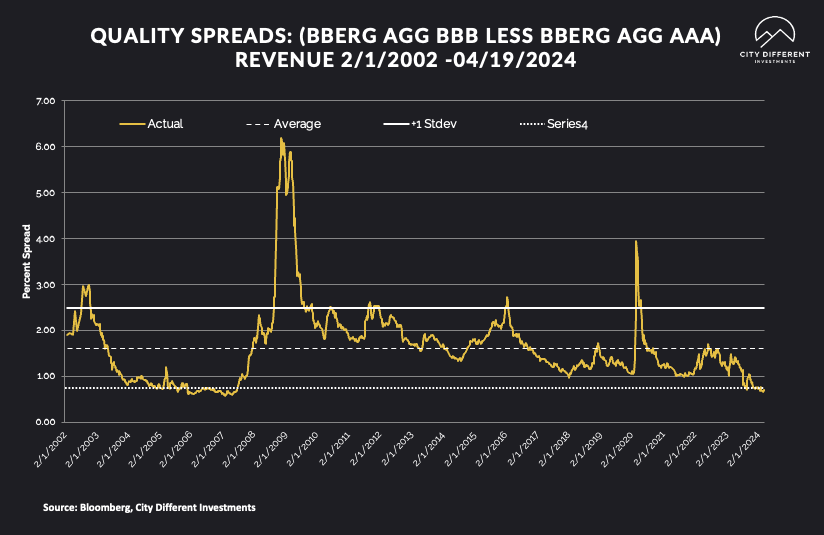
Quality spreads in the taxable market are not attractive but were marginally higher, ending the week at 0.71, two basis points higher than last week. High-yield quality spreads were 3.02%, 30 basis points wider than April 12.
WHERE ARE FIXED-INCOME INVESTORS PUTTING THEIR CASH?
Money Market Flows (millions of dollars)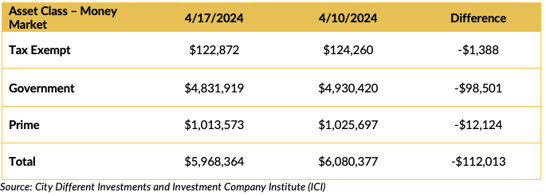
Money market funds saw a big drop in cash flows. This is continuation of the outflow trend from last week.
Mutual Fund Flows (millions of dollars)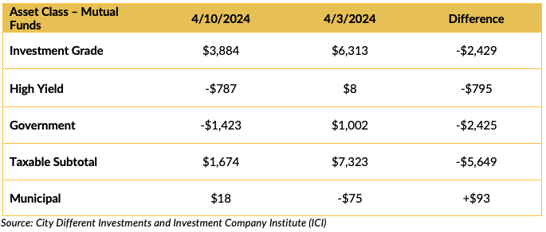
Bond funds saw decreased cash flows with the exception of Munis. Muni funds eked out a positive inflow week.
ETF Fund Flows (millions of dollars)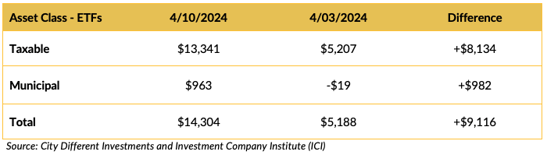
All ETF asset classes saw positive flows.
SUPPLY OF NEW ISSUE MUNICIPAL BONDS
This is a big supply week. Supply for the municipal tax-exempt calendar will likely hit $13 billion this week. Between April tax selling and big supply, we would like to see Muni rates catch up to their Treasury counterparts.
CONCLUSION
We are excited about the high supply week in the municipal market, along with April’s tax selling. This should create buying opportunities in the municipal world. In a review of last week, we have seen resetting of rate cuts for the year which has been pushed out. We are also witnessing speculations towards a 10-year Treasury yield of 5%. The rates rally will have to be driven by at least one of the criteria we outlined earlier. For those waiting for the shoe to drop because of the Treasury curve inversion, this is a gentle reminder that we have seen the curve inverted a variety of times.
IMPORTANT DISCLOSURES
The information and statistics contained in this report have been obtained from sources we believe to be reliable but cannot be guaranteed. Any projections, market outlooks or estimates presented herein are forward-looking statements and are based upon certain assumptions. Other events that were not taken into account may occur and may significantly affect the returns or performance of these investments. Any projections, outlooks or assumptions should not be construed to be indicative of the actual events which will occur. These projections, market outlooks or estimates are subject to change without notice.
Please remember that past performance may not be indicative of future results. Different types of investments involve varying degrees of risk, and there can be no assurance that the future performance of any specific investment, investment strategy, or product or any non-investment related content, made reference to directly or indirectly herein will be profitable, equal any corresponding indicated historical performance level(s), be suitable for your portfolio or individual situation, or prove successful. Due to various factors, including changing market conditions and/or applicable laws, the content may no longer be reflective of current opinions or positions.
All indexes are unmanaged, and you cannot invest directly in an index. Index returns do not include fees or expenses. Actual portfolio returns may vary due to the timing of portfolio inception and/or investor-imposed restrictions or guidelines. Actual investor portfolio returns would be reduced by any applicable investment advisory fees and other expenses incurred in the management of an advisory account.
You should not assume that any discussion or information contained herein serves as the receipt of, or as a substitute for, personalized investment advice from City Different Investments. To the extent that a reader has any questions regarding the applicability above to his/her individual situation or any specific issue discussed, he/she is encouraged to consult with the professional advisor of his/her choosing. City Different Investments is neither a law firm nor a certified public accounting firm and no portion of this content should be construed as legal or accounting advice.
A copy of City Different Investments' current written disclosure statement discussing our advisory services and fees is available for review upon request.
Unless otherwise noted, City Different Investments is the source of information presented herein.
A description of the indices mentioned herein are available upon request.