

WEEK ENDING 4/5/2024
- New support level for Treasury market with 10-year yields at 4.5%.
- Strong job numbers from Friday challenge rate cuts.
- April tax seasonality generally means outflow for money markets and reserves.
A CITY DIFFERENT TAKE
Last week’s Treasuries and risk market sell-off has left the 10-year Treasury yield at a weekly average of 4.5%. In addition, the week signaled 60 basis points of rate cuts for the year. Interest rate swaps are implying two rate cuts for 2024 starting in September. Last Friday, the probability of a third rate cut was about 50%.
Now, what happens if the 10-year Treasury yield stays above 5%? Does that mean another hike is on the table? Remember that the Fed Chair spoke last week prior to the release of employment numbers and reiterated that there is a need for greater confidence that inflation moves down to 2% before cutting interest rates.
Strong job numbers on Friday continue to point toward payroll growth. Nonfarm employment numbers increased by 303,000 in March. Unemployment now stands at 3.8%. The strength in the labor market seems to be challenging the rate-cut camp. ISM numbers also supported the strength of the economy. The ISM manufacturing index rose for the first time in 18 months.
April is here and that means spring showers for those of us in the Northeast and tax filing for all. Tax season means outflows and liquidity from money markets and bank reserves in both the taxable and tax-exempt markets. Economists are predicting a good tax-receipt collection based on tight labor market conditions and positive equity performance for 2023.
CHANGES IN RATES
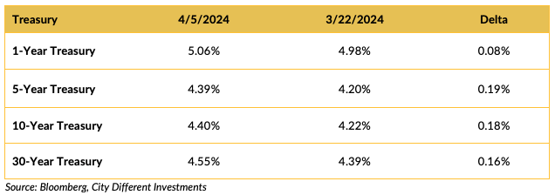
The Treasury market saw an increase in rates based on market reaction to strong payroll numbers.
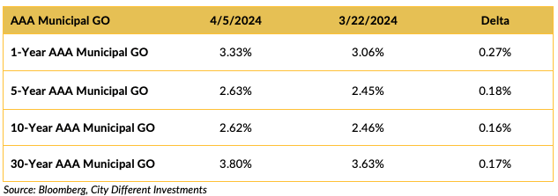
The municipal market’s yields moved higher on the week. The market is seeing an increase in supply which acts to revalue an already rich (relative to taxable securities) municipal market.
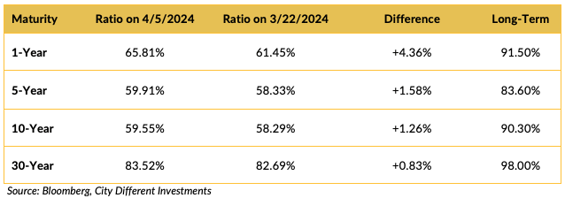
The municipal/Treasury ratios increased last week as the municipal market was hit with a seasonal increase in new issue supply. Ratios are reflective of the increase in municipal rates for last year.
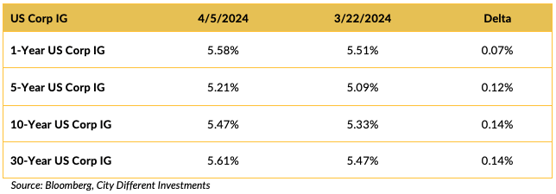
This market segment followed the Treasury markets and saw higher rates last week.
THIS WEEK IN WASHINGTON
.png?width=1920&name=graphs%20in%20order%20(1).png)
On the world stage, all eyes are on Israel. Israel claims that it is making progress in negotiating a cease-fire in Gaza. On a phone call last week, President Biden warned Israeli Prime Minister Benjamin Netanyahu that ongoing U.S. support depends on Israel taking steps to protect civilians.
On the domestic front, the Biden administration is proposing a new initiative to relieve student debt for as many as 30 million Americans, when combined with prior actions. This is President Biden’s second attempt to offer broad student debt relief after the Supreme Court struck down his previous efforts last year.
Meanwhile, in Congress, Rep. Marjorie Taylor Greene is working on replicating former Speaker Kevin McCarthy’s exit, this time for current Speaker Mike Johnson. Greene has filed for a motion to vacate Johnson, who is facing a crisis in his party over his efforts to pass a $95 billion funding measure for Ukraine, Israel, and Taiwan.
WHAT, ME WORRY ABOUT INFLATION?
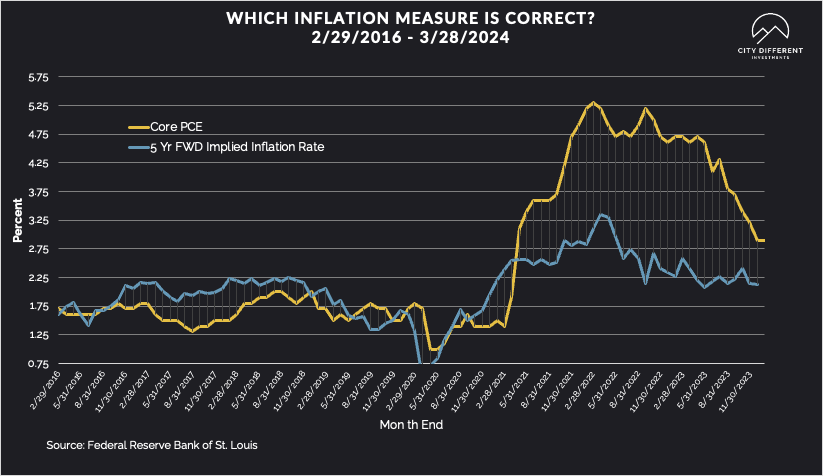
The 5-year Breakeven Inflation Rate finished the week of April 5 at 2.29%, three basis points higher than the March 28 close of 2.26%. The 10-year Breakeven Inflation Rate finished the week at 2.37%, five basis points higher than the close of March 28.
MUNICIPAL CREDIT
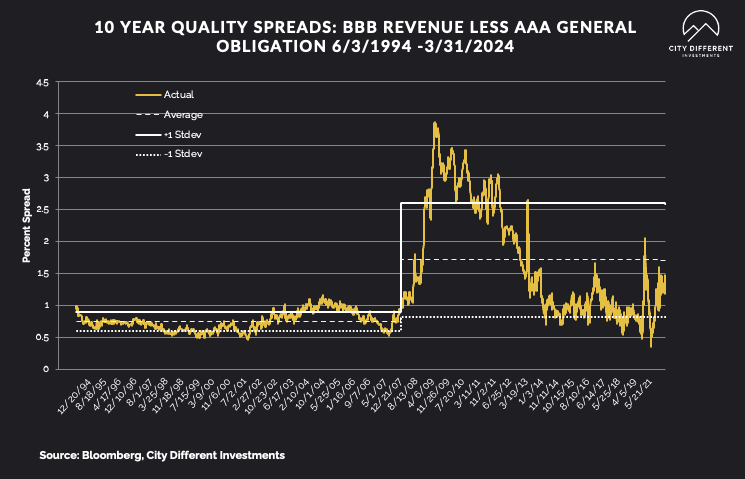
10-year quality spreads (AAA vs. BBB) as of March 22 were 1.22%, two basis points higher than the March 15 reading of 1.20% (based on our calculations). The long-term average is 1.71%.
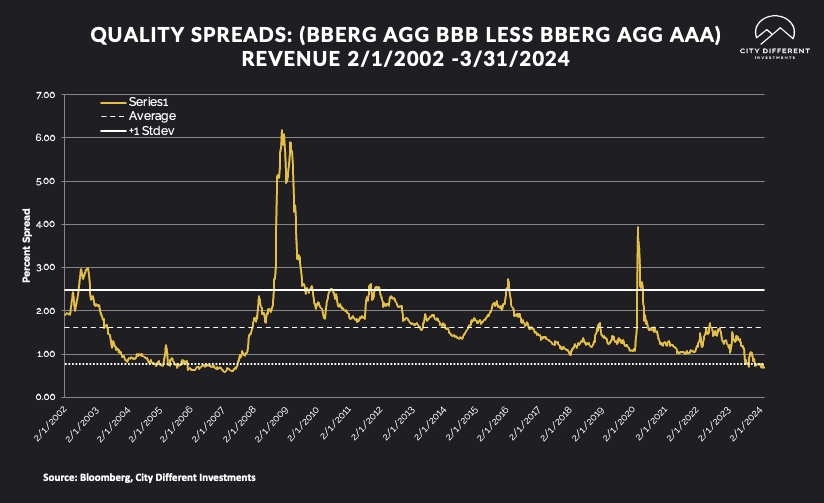
Quality spreads in the taxable market are not attractive but were slightly higher, ending the week at 0.70%, two basis points higher than last week. High-yield quality spreads were 2.64% on April 5.
WHERE ARE FIXED-INCOME INVESTORS PUTTING THEIR CASH?
Money Market Flows (millions of dollars)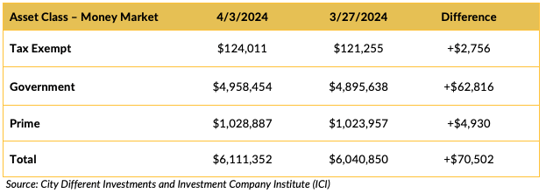
Money market funds saw an increase in positive cash flows. Their yields are hard to beat, even if the duration is in question.
Mutual Fund Flows (millions of dollars)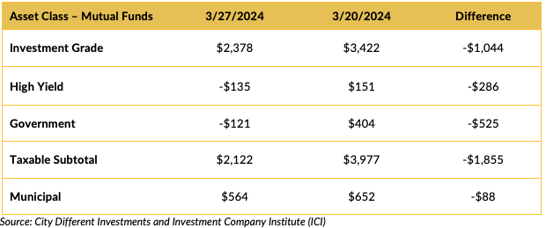
Bond funds saw a reduction in cash flows.
ETF Fund Flows (millions of dollars)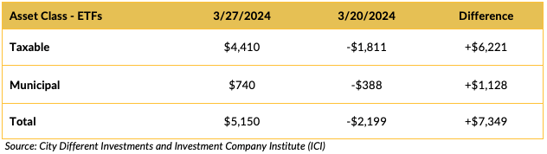
ETF Funds saw increase inflows compared to the week prior.
SUPPLY OF NEW ISSUE MUNICIPAL BONDS
Supply for the municipal tax-exempt calendar is expected to hit $8.6 billion this week.
CONCLUSION
Welcome to tax season and the cash flow seasonality that it brings for bank reserves and money market funds. Monetary policy continues to hold center stage. We have moved significantly from a six-rate-cut narrative to (now) two for the year. Strong employment and ISM manufacturing show an economy that will not roll over.
IMPORTANT DISCLOSURES
The information and statistics contained in this report have been obtained from sources we believe to be reliable but cannot be guaranteed. Any projections, market outlooks or estimates presented herein are forward-looking statements and are based upon certain assumptions. Other events that were not taken into account may occur and may significantly affect the returns or performance of these investments. Any projections, outlooks or assumptions should not be construed to be indicative of the actual events which will occur. These projections, market outlooks or estimates are subject to change without notice.
Please remember that past performance may not be indicative of future results. Different types of investments involve varying degrees of risk, and there can be no assurance that the future performance of any specific investment, investment strategy, or product or any non-investment related content, made reference to directly or indirectly herein will be profitable, equal any corresponding indicated historical performance level(s), be suitable for your portfolio or individual situation, or prove successful. Due to various factors, including changing market conditions and/or applicable laws, the content may no longer be reflective of current opinions or positions.
All indexes are unmanaged, and you cannot invest directly in an index. Index returns do not include fees or expenses. Actual portfolio returns may vary due to the timing of portfolio inception and/or investor-imposed restrictions or guidelines. Actual investor portfolio returns would be reduced by any applicable investment advisory fees and other expenses incurred in the management of an advisory account.
You should not assume that any discussion or information contained herein serves as the receipt of, or as a substitute for, personalized investment advice from City Different Investments. To the extent that a reader has any questions regarding the applicability above to his/her individual situation or any specific issue discussed, he/she is encouraged to consult with the professional advisor of his/her choosing. City Different Investments is neither a law firm nor a certified public accounting firm and no portion of this content should be construed as legal or accounting advice.
A copy of City Different Investments' current written disclosure statement discussing our advisory services and fees is available for review upon request.
Unless otherwise noted, City Different Investments is the source of information presented herein.
A description of the indices mentioned herein are available upon request.