

WEEK ENDING 4/11/2025
- Tariffs! Tariffs! Tariffs!
- “When Morons Ruled the World.”
- If you let them eat cake, pretty soon they will be eating your cake.
- We will be taking a break next week for the holidays.
A CITY DIFFERENT TAKE
Tariffs, tariffs, tariffs. This is what has been roiling the capital markets since “Liberation Day.” They’re on again. Then they are paused. (Some might call that a blink.) Or major segments are exempted. One of the first rules of playing poker is don’t bluff if you can’t afford the cost of the bluff. The tariffs have caused significant market turmoil. One bright spot (at least for fixed-income portfolio managers) is that the fixed-income markets have moved from “redheaded stepchild” of the capital markets to front-page headlines.
“The Bond Market’s Rout Is Bad News for the U.S. Economy” (Not the headlines we were hoping for)
The following table illustrates the volatility of the capital markets over the last week and year to date:

Tariffs are now paused at 10% for all countries except China. The U.S. tariff on Chinese exports (as of this writing — but that can change) is 145%, China retaliated by levying U.S. goods at 125%, up from the prior 84%.
“China on Friday retaliated against U.S. President Donald Trump’s country-specific tariffs by raising its levies on U.S. goods to 125% from 84%,” the Chinese Finance Ministry said.
“Even if the U.S. continues to impose higher tariffs, it will no longer make economic sense and will become a joke in the history of world economy,” the ministry said in a statement, according to a CNBC translation. (Someone knows the rules of poker.)
The Yale Budget Lab estimates that the average effective tariff rate is 25.2% — the highest since 1909 — and will hike prices by an additional 2.7% in 2025.
Even after Trump paused some tariffs, U.S. consumers face an average effective tariff rate of 25.2%, the highest since 1909, the Yale Budget Lab found in its report on Thursday. An effective tariff rate factors in the impact of tariffs on imports of finished goods as well as inputs used by domestic firms.
Current tariffs are expected to hike prices by an additional 2.7% in 2025, costing consumers on average about $4,400 per household over that time, the Yale Budget Lab said. Bummer
The Smoot-Hawley Tariff Act was signed into law in June of 1930, raising the average tariff rate on dutiable imports from 13.5% to 20%.
Trump's plan could implement higher tariffs than enacted during the Great Depression, raising the average U.S. import duty to more than 22 percent. (The rhyme of history.)
The markets saw two good inflation releases this week. Both CPI and PPI came in below expectations and last month’s readings at the year-over-year core levels. This type of news would normally be treated well by the fixed-income markets but — as the above table indicates — “not so much” in this tariff burdened environment.
Some of the “soft data” that Chair Powell has referred to are showing signs of continued weakness. This should begin to impact consumer behavior. The preliminary University of Michigan Consumer index was released Friday. The reading was significantly below expectations and the previous reading. It came in at 50.8, the lowest reading since June 30, 2022. See graph below:

Saturday morning greeted the markets to find that phones, computers, and chips are exempt from the new tariffs. (Is that blink #2?) Can't tell the tariff without a program.
Competence in a governing administration looks a lot like a Voltaire observation, “Common sense is not so common.” When it comes to this trade war, it seems the administration is playing checkers while our major trading partners are playing chess.
CHANGES IN RATES

Yield changes in the Treasury market were chaotic and significant (see table above). Barron’s defined it as follows:
The yield on the benchmark Treasury 10-year note rose almost one-half percentage point this past week to 4.49% in often chaotic trading that former Treasury Secretary Larry Summers likened to an occurrence in an emerging market country. The 30-year Treasury came close to 5% on Friday before pulling back to a 4.9% yield. (Chaos in the Treasury market.)
The yield curve, as measured by the yield difference between the two- and ten-year Treasury securities, steepened from 0.33% last week to 0.52% at the close on April 11. To the CDI fixed-income team, this indicates an increase in risk premiums at least on a duration basis. The long-term average of this spreads in +1.00%.

The volatility experienced in the Treasury market was exacerbated in the municipal market — so much so that a potential client asked us:
“WHAT IS GOING ON WITH MUNIs the past few days? Any color besides ‘tariffs’?”
Their caps, not ours. Our response on the afternoon of April 8 was:
“Yes, munis have certainly taken it in the shorts the last couple of days. There are several reasons why:
- Seasonally high levels of new issue supply ($10 billion this week) tend to drive yields higher and prices lower. The spring typically sees high levels of new issues as issuers recover from the holidays, known as the January effect.
- Mutual funds are probably sellers due to client cash withdrawals.
a. No data is available to support this point yet (we’ll probably see it in the next couple of days) but my experience at Vanguard (where the hurdle rates to moving money are low) leads me to believe this is the case. - Tariff uncertainty and a much lower risk appetite by Wall Street will drive all fixed income prices lower and yields higher. This confluence of events negatively impacts smaller, less liquid markets (like munis) more.
- Tax season is upon us and many investors sell municipal bonds to pay their taxes.
- Finally, the risk of some change to the tax-exempt status of municipal bonds plays a role. We think this is a low probability event but not a zero-probability event. There are several proposals being tossed about but, like the tariff discussions, no real firm guidance.
“Yesterday was probably the worst repricing of the municipal market in years (+0.35% across the curve). Today is not much better (+0.20% to 0.25% across the curve). Municipal/Treasury ratios (a good value measure) are the highest we have seen in months. There are several self-correcting events taking place in this market, many new deals are getting pulled, thus lowering the Street's risk exposure. In fact, we wanted to buy three new deals today and all were postponed. We think this is a good time to selectively buy some bonds; we have been on the sidelines the last 10 days.
We also followed up with a little more data from JP Morgan to readdress point:
“Amidst a volatile sell-off in the UST market, yesterday saw the highest single-day outflow from tax-exempt funds (-$702 million) since Dec. 2022, leading to near-record BWIC volume ($5.6 billion), and the largest single-day long-end high-grade scale cut (35bps) since the pandemic (50bps on April 1, 2020). For further context, yesterday marked the 6th largest single-day cut since the inception of the HG scale in 1981. Moreover, long-dated tax-exempt yields are now at their second-highest levels in over a decade.”
We think this explanation still holds true and that is why we inserted it here.

Relative yield ratios corroborate the increased volatility in the municipal bond market. Reflect the difference in yield changes for the two fixed-income markets. Ratios have gotten much cheaper for munis.

Corporate yields were higher week over week, in line with the theme.
THIS WEEK IN WASHINGTON

Elon Musk and Peter Navarro seem to be at odds. Trouble in paradise? We would be testy too if we lost $135 billion in the first 3 months of 2025. Ouch. We will not shed a tear for Elon, rather save them for all the displaced federal workers.
Elon Musk took another jab at President Donald Trump’s senior trade adviser Peter Navarro Tuesday, calling him a “moron” on social media as the Tesla CEO further splits from the White House’s tariffs plan.
Musk’s remarks were in response to a CNBC interview with Navarro on that aired Monday, during which the White House trade adviser discussed how Tesla’s position as a “car assembler” rather than a car manufacturer could be at odds with Trump’s tariff policies.
If that wasn’t enough Musk later added:
Musk said Navarro “is truly a moron” in an X post replying to a video of the comments being shared on the social media platform. “What he says here is demonstrably false,” he wrote, before calling Navarro “Peter Retarrdo” in another derogatory comment.
Musk claimed “Tesla has the most American-made cars,” in another series of X posts, adding that “Navarro is dumber than a sack of bricks.” (Their mothers must be proud.)
When the White House press secretary was asked about the exchange, she responded,
“These are obviously two individuals who have very different views on trade and on tariffs. Boys will be boys and we will let their public sparring continue.” Adding, “I think it also speaks to the president’s willingness to hear from all sides that he has people at the highest levels of this government, in this White House, who have very diverse opinions on very diverse issues.”
We don’t know about you all, but we would rather have adults run the country instead of “boys.”
In other Washington news, there’s more debt on the horizon. House Republicans approved a multitrillion-dollar budget paving the way for Trump’s domestic policies including tax cuts and spending on defense, energy, and immigration
An analysis by Steven Rattner shows the House’s original bill and its $2.8 trillion addition to the deficit compared to the approved Senate version and its $5.8 trillion deficit increase.

Where is Steven Rattner’s border collie when we need it? (More debt in our future?) One corollary to the deficit and debt issues facing the U.S. is the question of who owns our debt. The top five countries (as of Nov. 2024) are:
- Japan: $1.1 trillion
- China: $768.6 billion
- United Kingdom: $765.6 billion
- Luxembourg: $424.5 billion
- Cayman Islands: $397 billion
The top three are involved in the tariff imbroglio and the number two owner is miffed with us to say the least. What if the top three decide to not support our debt auctions? Or sell their holdings? You can draw your own conclusions.
Finally, a comment about the SAVE act. This is a hotly debated issue in Chris’s home. His wife hyphenated her last name when they were married in the ’80s.
Republicans, and apparently some Democrats, are still obsessed with limiting noncitizen voting, which is already illegal and exceedingly rare.
The House on Wednesday passed the Safeguard American Voter Eligibility Act, or SAVE Act, which would require people to present a passport, birth certificate, or other documentation proving citizenship in person in order to vote in elections. The legislation is so extreme that many have warned that it could even make it harder for married women to vote. Didn't the 19th Amendment settle this?
We thought this was a settled question! The current president is a fan of former President McKinley — in more ways than one. The McKinley administration lasted from 1897 through 1901. The 19th Amendment was not ratified until 1920.
“President McKinley made our country very rich through tariffs and through talent,” Trump said in his inauguration speech. “He was a natural businessman.”
Trump has vowed to impose tariffs on America's competitors abroad. More than a century ago, McKinley pushed so enthusiastically for tariffs he was dubbed by the press at the time the “Napoleon of Protection.” (In with the really old.)
WHAT, ME WORRY ABOUT INFLATION?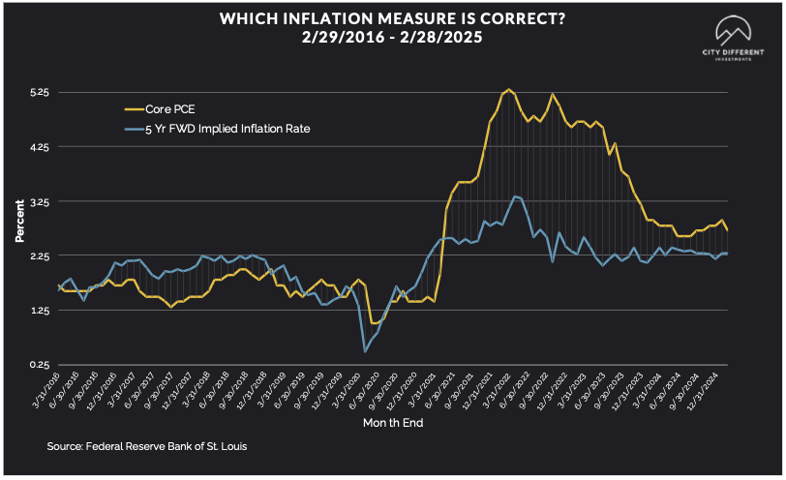
The 5-year Breakeven Inflation Rate finished the week of April 11 at 2.07%, 5 basis point higher than on April 4. The 10-year Breakeven Inflation Rate finished the week at 2.20%, 2 basis points higher week-over-week.
MUNICIPAL CREDIT

As of April 11, the 10-year quality spreads (AAA vs. BBB) were 0.93%, 10 basis points lower from the prior week (based on our calculations). The long-term average is 1.69%.
This appears odd but really is not. Lower-quality bonds are the last to trade, especially if municipal bond funds are seeing shareholder redemptions. Many municipal bond mutual fund portfolio managers sell what they can versus what they should when faced with significant redemptions. The remaining shareholders should be aware of the changing risk characteristics of their investments.
TAXABLE CREDIT

Quality spreads in the taxable market are not attractive. High-yield quality spreads are beginning to widen. Barron’s warns that:
Cracks are starting to form in the $1.5 trillion private-credit market, and the hot sector could face its first major test since exploding in size over the past decade.
They continue warning that:
Credit losses historically have been low — and investor returns high — but that could change if the economy weakens. Most of the funds are private or offer limited liquidity, but the $70 billion of publicly traded business development companies, or BDCs, offer a read on sentiment — and investors have gotten worried recently.
A sharp selloff has taken shares of BDCs down an average of 20% from their February highs, including Ares Capital (ARCC), Blue Owl Capital (OBDC),Blackstone Secured Lending (BXSL), and FS KKR Capital (FSK). They now yield 10% to 15%. (Chaos in the Treasury market.)
Joel Van Essen and Chris Ryon discuss the risks of alternative investing and highlight CDI’s different approach. See our blog “The Promise (and Peril) of Private Markets.” (No gain without risk.)
WHERE ARE FIXED-INCOME INVESTORS PUTTING THEIR CASH?
Money Market Flows (millions of dollars)
Overall, money market funds saw outflows.
Mutual Fund Flows (millions of dollars)
Cash flows into bond funds continued to stay negative week over week across all categories. The full effect of “Liberation Day” is not captured in these numbers.
ETF Fund Flows (millions of dollars)
ETF asset classes experienced much higher net flows for the week, driven by the taxable category.
SUPPLY OF NEW ISSUE BONDS
The supply of new municipal bond issues is expected to be closer to $8.4+ billion this week.
CONCLUSION
These are tough times and tough markets! The City Different Investments (CDI) fixed-income team has weathered tough markets before. Sweta and/or Chris have lived, survived, and learned from disruptions including:
- The bond market crash of 1987.
- The long-term capital management-induced meltdown of 1998, chronicled in Rodger Lowenstein’s “When Genius Failed.”
- The great financial crisis of 2007/08, retold in Andrew Ross Sorkin’s “Too Big to Fail.” (What about the vault?)
- The COVID crisis.
- Today’s trade war.
How will this story be told? We do not know but we think we have a title: “When Morons Ruled the World.”
It seems that the ruling elite are taking a “let them eat cake” approach to governing. The problem with this approach is that if you let them eat cake, pretty soon they will be eating your cake.
The CDI fixed-income team will draw on its experience and value measures to protect our clients’ assets as we invest in the new environment together. To put it another way, we invest along with our clients or we eat our own cooking.
We are maintaining our neutral duration positioning, our overweight to the short end of our strategies investment universes, and our overweight to higher quality securities.
IMPORTANT DISCLOSURES
The information and statistics contained in this report have been obtained from sources we believe to be reliable but cannot be guaranteed. Any projections, market outlooks or estimates presented herein are forward-looking statements and are based upon certain assumptions. Other events that were not taken into account may occur and may significantly affect the returns or performance of these investments. Any projections, outlooks or assumptions should not be construed to be indicative of the actual events which will occur. These projections, market outlooks or estimates are subject to change without notice.
Please remember that past performance may not be indicative of future results. Different types of investments involve varying degrees of risk, and there can be no assurance that the future performance of any specific investment, investment strategy, or product or any non-investment related content, made reference to directly or indirectly herein will be profitable, equal any corresponding indicated historical performance level(s), be suitable for your portfolio or individual situation, or prove successful. Due to various factors, including changing market conditions and/or applicable laws, the content may no longer be reflective of current opinions or positions.
All indexes are unmanaged, and you cannot invest directly in an index. Index returns do not include fees or expenses. Actual portfolio returns may vary due to the timing of portfolio inception and/or investor-imposed restrictions or guidelines. Actual investor portfolio returns would be reduced by any applicable investment advisory fees and other expenses incurred in the management of an advisory account.
You should not assume that any discussion or information contained herein serves as the receipt of, or as a substitute for, personalized investment advice from City Different Investments. To the extent that a reader has any questions regarding the applicability above to his/her individual situation or any specific issue discussed, he/she is encouraged to consult with the professional advisor of his/her choosing. City Different Investments is neither a law firm nor a certified public accounting firm and no portion of this content should be construed as legal or accounting advice.
A copy of City Different Investments' current written disclosure statement discussing our advisory services and fees is available for review upon request.
Unless otherwise noted, City Different Investments is the source of information presented herein.
A description of the indices mentioned herein are available upon request.