
WEEK ENDING 4/4/2025
- The only certainty is uncertainty.
- New tariff regime most extensive since 1968.
- US recession forecast now over 50%.
A CITY DIFFERENT TAKE
“If you can keep your head when all about you are losing theirs and blaming it on you...” — Rudyard Kipling
At a press conference last week, Warren Buffet quoted the above Kipling poem “If—” which certainly applies to these volatile markets. We at City Different Investments would like to take a moment to recap the market-moving aftermath from the tariff announcements on “Liberation Day.” First, we should get some of the basics out of the way:
The fixed-income team at CDI believes tariffs:
- Are a tax on the consumer.
- Will add to inflationary pressures.
- Will ignite a trade war. (China has already counter-punched with 34% reciprocal tariffs on the U.S.)
The old saying “do not beggar thy neighbor” comes to mind. Wikipedia defines the phrase as “an economic policy through which one country attempts to remedy its economic problems by means that tend to worsen the economic problems of other countries.” In our estimation, fear has been the major driving force in equity and bond market volatility over the last few weeks.
The CDI fixed-income team relies on three value metrics to arrive at its decision to invest and where to invest.
Real Yields (Security Yield Less Inflation)
The recent rally in the Treasury market has significantly reduced the “real yields” of Treasury securities across the maturity spectrum. The Core U.S. Personal Consumption Expenditure (PCE) Index has proven sticky; four of the last five readings are at 2.8%.
“More certain is that Mr. Trump's tariffs will boost inflation,” noted Gregory Daco, chief economist at EY. “Consumer prices could accelerate by 1 percentage point by year-end,” he added, “which would boost the inflation rate close to 4% from its current level.”
The last year-over-year CPI reading was 2.8% (in line with core PCE). The following table calculates the “real yields” for several Treasury tenors:

CHANGES IN RATES

There were big changes in Treasury yields week-over-week. This week the yield curve bear flattened with the 1-to-10-year part of the curve now at 15 basis points.
Our current estimate of Treasury real yields is not even close to their long-term averages. For those so inclined, these real yield estimates are between -0.37 through -1.07 standard deviations and their long-term averages, which in English means that they are very rich. Further evidence that fear — not fundamentals — is driving the Treasury market.
The Slope of the Yield Curve:
The slope of the Treasury curve is measured by the yield difference between the 2-year maturity and the 10-year maturity. On April 1, that spread was 0.30%. As of this writing, spreads were 0.37%. The 20-year average is 1.34%. The conclusion is the yield curve is very flat, so we will continue to focus on the shorter end of our strategies investment horizons.
Relative Value:
Even with the rally in Treasury prices (lower yields), an investor still gets approximately 92% of the yield of a 10-year Treasury bond from a 5-year Treasury bond with only about 50% of the duration risk. Now, that’s value.
What will the Federal Reserve do?
The current Bloomberg World Interest Rate Probability Function estimates the Fed will cut short-term rates by over 1.25% by Dec. 31, with probabilities ranging from 47.1% to 104.7%. Last month, three 0.25% cuts were the estimate du jour. We think these current estimates are overdone (another sign of fear). The Fed has a dual mandate: price stability (inflation) and maximum sustainable employment.
CDI estimates (as do many economists) that inflation is rising due to the Trump tariffs and our trading partners’ reaction to them (e.g., China). The economy looks stable given the most recent employment report (gains of 228,000 compared to estimates of 130,000). But this reading does not capture the federal workforce reduction efforts — maybe next month.
As mentioned before, inflation is on the rise. What is the Fed to do? How about nothing, until the hard data shows significant weakness. We heard from the chair on Friday, who is worried about inflation. The Fed must be certain that inflation expectation is anchored.
Due to the above analysis, CDI’s fixed-income team will be cautious before committing significant assets to the taxable market. The municipal market is another question. The municipal market is suffering from a seasonal spike in new issuance, which may provide some opportunities.
For those clients that have well-diversified portfolios, take solace in the fact that diversification has its benefits. For those clients that are not well-diversified, have patience. In times like these, in addition to drawing from Rudyard Kipling, we like to think of Chris’s old boss Ian MacKinnon, who counseled the managers he oversaw with these words: “Fear is not an investment strategy.”
But tariff uncertainty is being felt globally. Currently, tariffs are 10%, with higher country-specific tariffs going into effect on April 9.
For the fixed-income world, this translates into:
- How low will rates go?
- How high will spreads go?
One of the most interesting comparisons we have seen is by Strategas Research, which equates the current environment to August 1990 and the Iraq invasion of Kuwait. The invasion was translated as a supply shock. At the time, we were in a Fed easing cycle. However, the invasion caused the Fed to pause easing, which it resumed a few months later.
The market reacted by 10-year Treasury yields going up.
If we use the 1990 invasion as a template, we could expect a shallow contraction leading to a shallow recession. The Fed would bring rates down to 2–3% which would translate to 10-year Treasury around 3%. The bond market is screaming at the Fed that it’s behind the curve. However, there are no problems in the credit market to force the Fed’s hand.
In the scenario of a shallow recession, the market has priced in 150 basis points of cuts between now and June.
Investment grade spreads were close to 95 basis points during the ’90s, jumping to 150 basis points. This is well below the Great Financial Crisis and COVID. Shallow recession will see spreads between 100–200 basis points. Anything higher than that would be a deeper recession.

Interest rates in the municipal market moved significantly lower. Municipals are dealing with heavy April supply and tax selling in addition to tariff reactions.

Relative yield ratios reflect the difference in yield changes for the two fixed-income markets. Ratios got more expensive for munis.

Corporate yields were lower week over week, in line with the theme.
THIS WEEK IN WASHINGTON

President Trump commented over the weekend that “they” (other nations) are looking to make a deal with relation to his tariffs.
Trump’s tariffs have roiled global markets, to the point that even his supporters are calling for him to stand down or risk a “a self-induced, economic nuclear winter.”
In non-tariff news (yes, there are other things happening in Washington), the Senate passed a resolution allowing 2017 tax cuts to extend, allowing for an increase to the U.S. debt ceiling. This is the next phase of President Trump’s two-part economic agenda of “tariffs and taxes.” It means a $5 trillion increase to the federal borrowing limit and allows for $1.5 trillion in new tax cuts over the next 10 years. The resolution will make its way to the House this week.
WHAT, ME WORRY ABOUT INFLATION?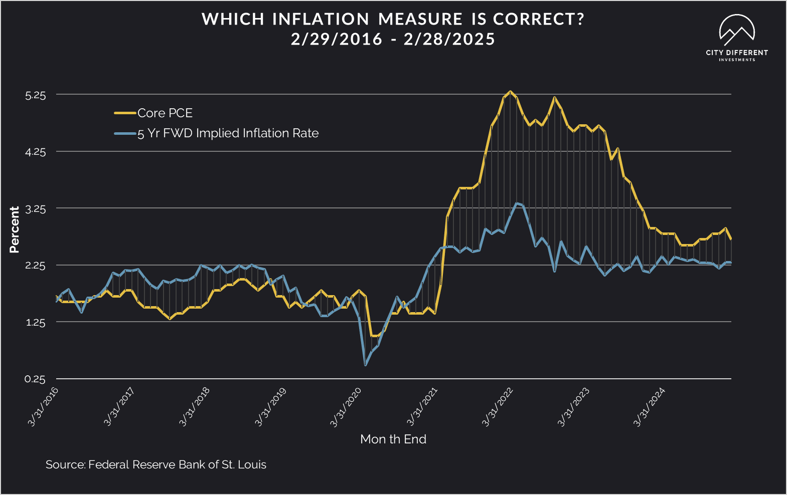
The 5-year Breakeven Inflation Rate finished the week of March 28 at 2.16%, 1 basis point higher than March 21. The 10-year breakeven inflation rate finished the week at 2.37%, which is 4 basis points higher week-over-week.
MUNICIPAL CREDIT

As of April 4, the 10-year quality spreads (AAA vs. BBB) were 1.035%, up 4 basis points from the prior week (based on our calculations). The long-term average is 1.69%.
TAXABLE CREDIT

Quality spreads in the taxable market are not attractive. They ended the week at 1.14%, 16 basis points higher than the prior week. High-yield quality spreads were wider by 80 basis points at 4.08% week-over-week.
WHERE ARE FIXED-INCOME INVESTORS PUTTING THEIR CASH?
Money Market Flows (millions of dollars)
Overall, money market funds saw increased flows.
Mutual Fund Flows (millions of dollars)
Cash flows into bond funds continued to stay negative week over week across most categories.
ETF Fund Flows (millions of dollars)
ETF asset classes experienced much higher net flows for the week, driven by the taxable category.
SUPPLY OF NEW ISSUE BONDS
The supply of new municipal bond issues is expected to be closer to $10+ billion this week.
CONCLUSION
The VIX Index has shot up to 45, the put-call ratio is current at 1.25, and more money has flowed into shorting the S&P. All of these indicators point to a negative view on the economy. It truly is the terror of tariffs wreaking havoc in the market. We are in a historic period, but the market hasn’t turned disorderly — yet. The Fed is gun-shy on inflation and came out this Friday saying it's going to wait and watch. However, the odds of a recession in 2025 have gone up significantly.
IMPORTANT DISCLOSURES
The information and statistics contained in this report have been obtained from sources we believe to be reliable but cannot be guaranteed. Any projections, market outlooks or estimates presented herein are forward-looking statements and are based upon certain assumptions. Other events that were not taken into account may occur and may significantly affect the returns or performance of these investments. Any projections, outlooks or assumptions should not be construed to be indicative of the actual events which will occur. These projections, market outlooks or estimates are subject to change without notice.
Please remember that past performance may not be indicative of future results. Different types of investments involve varying degrees of risk, and there can be no assurance that the future performance of any specific investment, investment strategy, or product or any non-investment related content, made reference to directly or indirectly herein will be profitable, equal any corresponding indicated historical performance level(s), be suitable for your portfolio or individual situation, or prove successful. Due to various factors, including changing market conditions and/or applicable laws, the content may no longer be reflective of current opinions or positions.
All indexes are unmanaged, and you cannot invest directly in an index. Index returns do not include fees or expenses. Actual portfolio returns may vary due to the timing of portfolio inception and/or investor-imposed restrictions or guidelines. Actual investor portfolio returns would be reduced by any applicable investment advisory fees and other expenses incurred in the management of an advisory account.
You should not assume that any discussion or information contained herein serves as the receipt of, or as a substitute for, personalized investment advice from City Different Investments. To the extent that a reader has any questions regarding the applicability above to his/her individual situation or any specific issue discussed, he/she is encouraged to consult with the professional advisor of his/her choosing. City Different Investments is neither a law firm nor a certified public accounting firm and no portion of this content should be construed as legal or accounting advice.
A copy of City Different Investments' current written disclosure statement discussing our advisory services and fees is available for review upon request.
Unless otherwise noted, City Different Investments is the source of information presented herein.
A description of the indices mentioned herein are available upon request.