

WEEK ENDING 4/14/2023
Highlights of the week:
- “Sticky prices” show no improvement in latest consumer price index.
- Another 25 basis points priced in for Fed’s May meeting. But what after that?
- Yield curve is finally steepening in the Fed’s new "wait-and-see” era.
A CITY DIFFERENT TAKE
Last week, the core consumer price index rose 0.4% from the previous month, bringing the core index to 5.6% YoY. There are a couple of takeaways here. One is the sticky nature of inflation in general. The other is the stubbornness of service sector inflation. Remember the core index excludes food and energy. The CPI headline number currently stands at 5%. The overall measure is lower because of a slowdown in energy prices.
We still have a high inflation number with a strong labor market. This only adds to the Fed’s conviction of another rate increase in May.
Swaps linked to the Federal Reserve meeting in May reflect an 86% chance of a 25-basis-point hike next month. This would put the federal funds rate in the range of 5.00% – 5.25%. In the same line, the Fed funds futures are predicting a target rate of 4.6% by December.
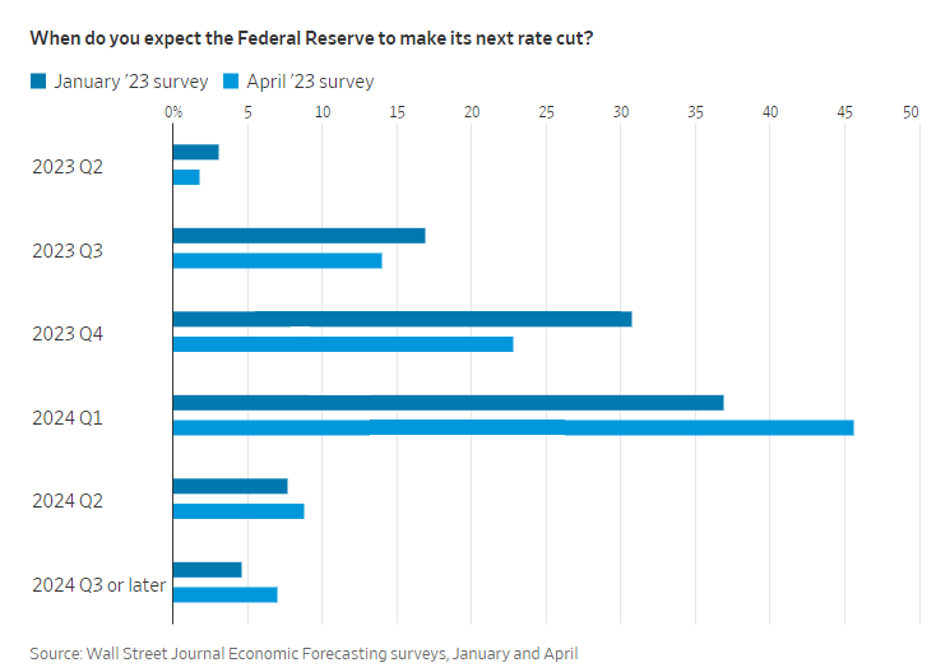
A quick pivot by the Fed is not supported by the dot plot, but the Fed futures market is expecting at least three rate cuts by January 2024. However, economist surveyed by the Wall Street believe in a different forecast and see no rate cuts before 2024.
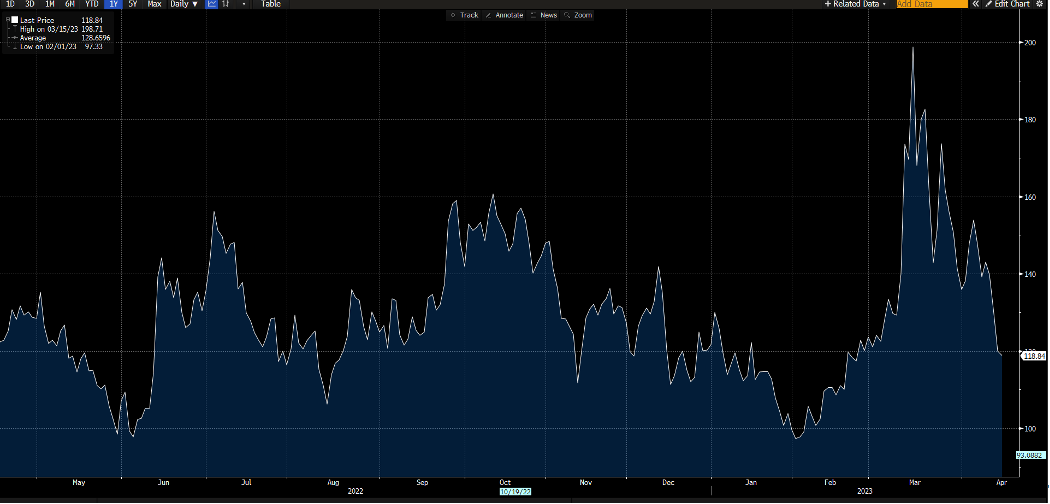
The ICE BofA MOVE index also shows market sentiment for the Fed following a less hawkish path. Regular readers will remember this is a yield curve weighted index that measures implied volatility on one-month Treasury options. This index reached its high of 199 during the banking uncertainty in March and currently stands at 119.
In recent commentaries, we shared we could make the case for both a bear and bull economy. In the Wall Street Journal’s aforementioned survey, a similar case is made with a probability of a recession in the next 12 months at 61% — the same number as January.
CHANGES IN RATES
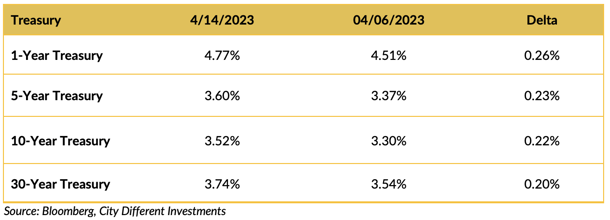
The Treasury curve steepened significantly across all tenors.
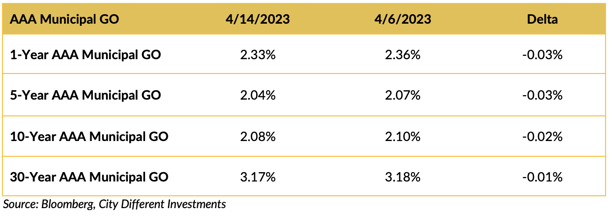
The municipal market’s week remained non-correlated to the Treasury’s. We continued to see strength in the muni. But balances remained on some new deals showing that investors are finding municipals rich.
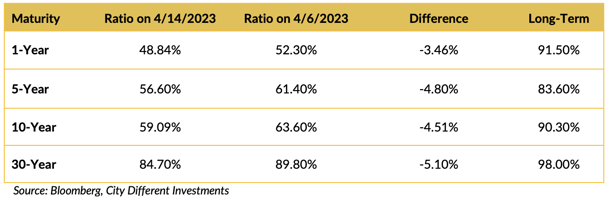
Municipals look extremely unattractive when looking at ratios. They have richened significantly since mid-March and remain expensive.
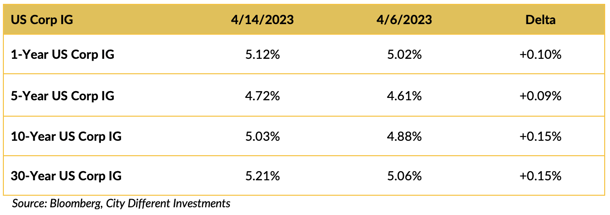
Yield in the investment grade (IG) corporate market moved higher on the week.
THIS WEEK IN WASHINGTON
.png?width=1920&name=graphs%20in%20order%20(1).png)
Back to the U.S. debt ceiling debate which continues to be a tail risk for the market.
When is the hard stop on political vacillation? That’s the question investors are grappling with.
Nearly no one needs a reminder that Tax Day is on Tuesday, but a strong cash collection figure close to $200 billion could possibly buy time until August.
On the House front, speaker McCarthy plans to roll out a proposal for one-year debt ceiling suspension this week.
WHAT, ME WORRY ABOUT INFLATION?
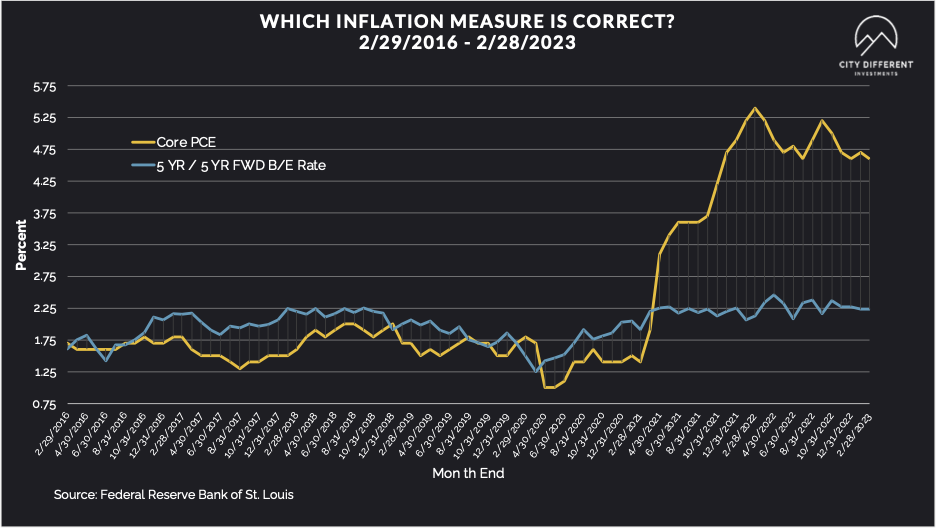
The 5-year Breakeven Inflation Rate ended Thursday at 2.29%, 12 basis points higher than the April 7 closing of 2.17%. The 10-year Breakeven Inflation Rate ended the week at 2.10%, 14 basis points lower than last week’s observation of 2.24%.
MUNICIPAL CREDIT
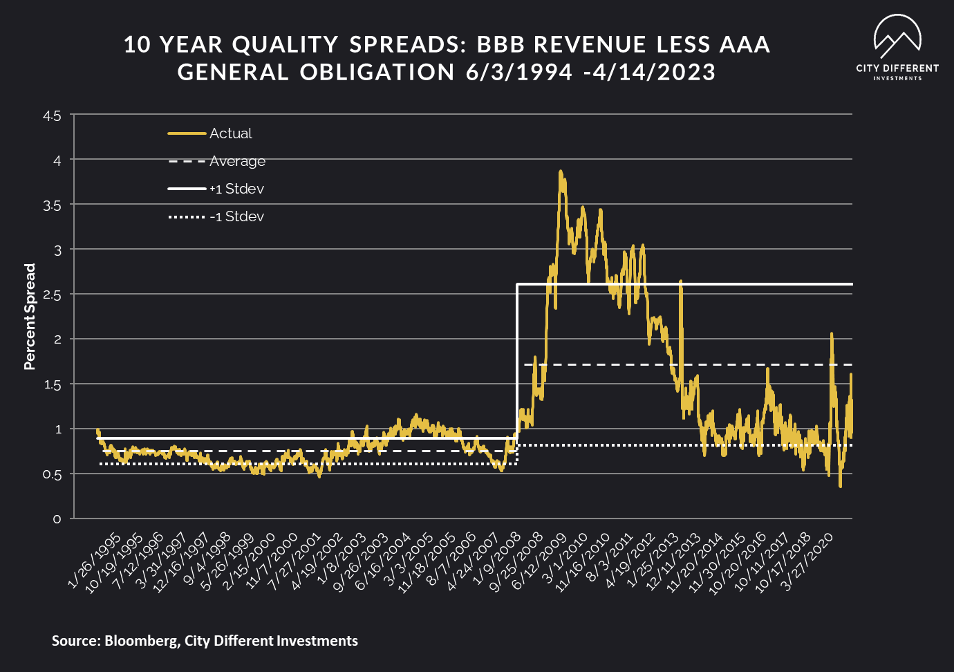
10-year quality spreads (AAA vs. BBB) were dipped slightly on the week from 1.31% to 1.28% (based on our calculations). The long-term average is 1.71%. By our way of thinking, lower quality securities are still not attractive.
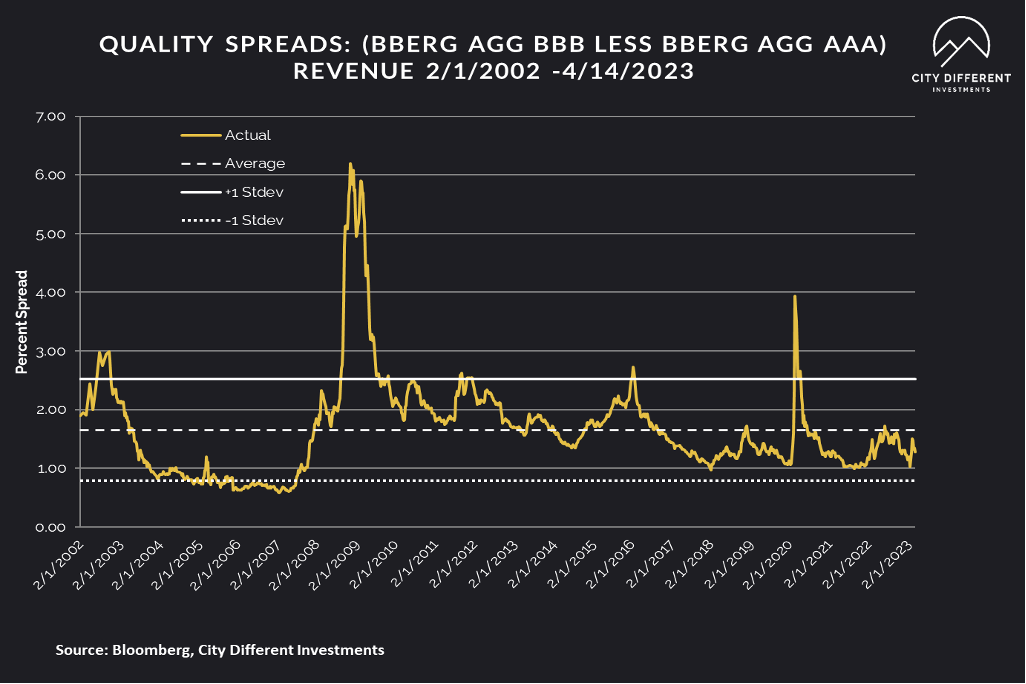
Quality spreads in the taxable market ended the week at 1.28%, 7 basis points lower than last week.
WHERE ARE FIXED-INCOME INVESTORS PUTTING THEIR CASH?
Money Market Flows (millions of dollars)
We are seeing stability return. Money market funds saw positive cash flows last week, especially government money market funds.
Mutual Fund Flows (millions of dollars)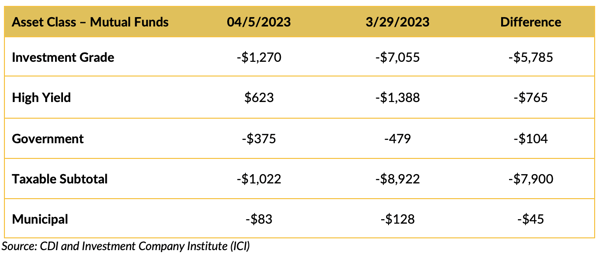
It looks like no one cared for bonds again last week. Can you blame them? Negative cash flow into municipal bond mutual funds, while still negative, slowed a bit.
ETF Fund Flows (millions of dollars)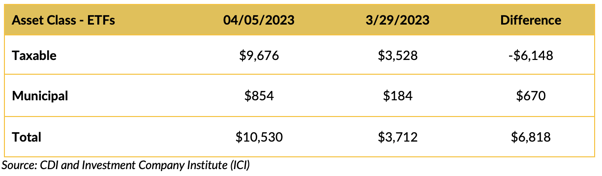
Other services that track ETF cash flows have reported big inflows into taxable l bond mutual funds and slightly into municipal bond funds.
SUPPLY OF NEW ISSUE MUNICIPAL BONDS
The municipal market is going to have a robust issuance this week of $12.1 billion. This will be a good test for the municipal market to see if it can follow suit with the Treasury market. We are hoping to see some weakening in the municipal market as it absorbs this calendar.
Total new issuance supply figures of $10 billion or more usually indicate weakness in new issue supply pricing (higher yields).
CONCLUSION
The May rate is sealed in at 25 basis points. But after that, the Fed’s path is unclear. Markets, dot plots, and economists are all at odds about the next steps for the Federal Reserve. Last week, the consumer price index showed a sticky CORE (fueled mostly by the service sector) at 5.6% YoY. And we finally witnessed a steepening in the Treasury curve.
IMPORTANT DISCLOSURES
The information and statistics contained in this report have been obtained from sources we believe to be reliable but cannot be guaranteed. Any projections, market outlooks or estimates presented herein are forward-looking statements and are based upon certain assumptions. Other events that were not taken into account may occur and may significantly affect the returns or performance of these investments. Any projections, outlooks or assumptions should not be construed to be indicative of the actual events which will occur. These projections, market outlooks or estimates are subject to change without notice.
Please remember that past performance may not be indicative of future results. Different types of investments involve varying degrees of risk, and there can be no assurance that the future performance of any specific investment, investment strategy, or product or any non-investment related content, made reference to directly or indirectly herein will be profitable, equal any corresponding indicated historical performance level(s), be suitable for your portfolio or individual situation, or prove successful. Due to various factors, including changing market conditions and/or applicable laws, the content may no longer be reflective of current opinions or positions.
All indexes are unmanaged, and you cannot invest directly in an index. Index returns do not include fees or expenses. Actual portfolio returns may vary due to the timing of portfolio inception and/or investor-imposed restrictions or guidelines. Actual investor portfolio returns would be reduced by any applicable investment advisory fees and other expenses incurred in the management of an advisory account.
You should not assume that any discussion or information contained herein serves as the receipt of, or as a substitute for, personalized investment advice from City Different Investments. To the extent that a reader has any questions regarding the applicability above to his/her individual situation or any specific issue discussed, he/she is encouraged to consult with the professional advisor of his/her choosing. City Different Investments is neither a law firm nor a certified public accounting firm and no portion of this content should be construed as legal or accounting advice.
A copy of City Different Investments' current written disclosure statement discussing our advisory services and fees is available for review upon request.
Unless otherwise noted, City Different Investments is the source of information presented herein.
A description of the indices mentioned herein are available upon request.