

WEEK ENDING 3/31/2023
Highlights of the week:
- 2% inflation: an outdated concept.
- Federal Reserve close to ending most aggressive interest rate hikes.
- CDI expects one more rate hike in May and then a pause.
- Market says “April Fools” to banking crisis.
A CITY DIFFERENT TAKE
Core PCE, the Federal Reserve’s favorite inflation gauge, was released last Friday for the month of February. The softer print does point to the path of a disinflationary economy. Monthly PCE increased by 0.3% (versus 0.6% in January). Headline PCE YoY is now at 5%. Core inflation stands at 4.6%. Underneath this number, the decline in inflation is mainly coming from durable goods inflation falling to 0.7% YoY.
The Fed has a new preferred measure of inflation: supercore. Unlike Core inflation, which includes housing, supercore inflation excludes gas, electric, and housing.
This supercore measure rose by 0.3% (as did month-on-month Personal Income), standing steady at 4.6% YoY. This is largely driven by service, recreation, medical care, and education. It tends to be stickier and is abetted by the strong labor market.
But by all measures, inflation remains in the mid-4% range for now.
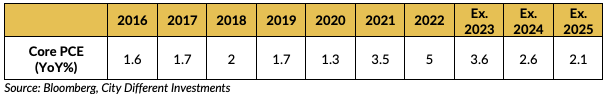
So here is the BIG question. Where will inflation land? Inflation seems to have peaked and started to decline. But it is still a long way from the Fed’s 2% target. Citi economists project core PCE inflation to land around 4.3% by the end of 2023. John Williams of the Federal Reserve Bank of New York expects this number to be around 3.25%. At City Different Investment, we also expect inflation to remain closer to the 3% range, seeing 2% inflation as an outdated concept.
Chairman Powell has maintained his bias for curbing underlying inflation to 2%. However, the market does not believe him. The Fed fund futures market is indicating a much higher probability of pausing, then cutting from June 2023. We at CDI believe we will see one more 25-bps rate hike from the Fed in May and then a pause thereafter.
Finally, the market took a break from the banking crisis last week. This was reflected in the Fed’s weekly balance sheet. Bank borrowing from the Federal Reserve through either the discount window or the Bank Term Funding Program (BTFP) was down by $11 billion. Wow. (The actual number stood at $153 billion.)
The circus in Washington tried to pin down a culprit for banking failures, tossing blame between the Treasury, the Fed, and the greedy bankers who did not heed risk management. We think the Fed and the Treasury have created a “psychological guarantee” for all depositors. But we continue to believe that the banking sector is strong, and the crisis was idiosyncratic. Much like in 2008, we are seeing the big banks becoming bigger.
CHANGES IN RATES
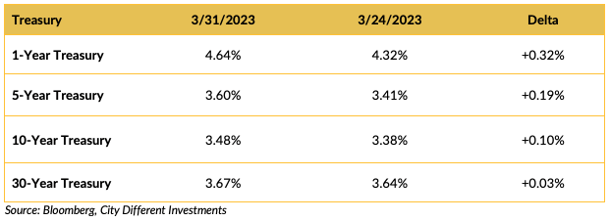
The week-over-week changes in Treasury yields show a rally last week after the Fed meeting. The 10-year Treasury rate stands at 3.48%. Bank of America calculates a volatility index for the Treasury market called the MOVE Index (see below).
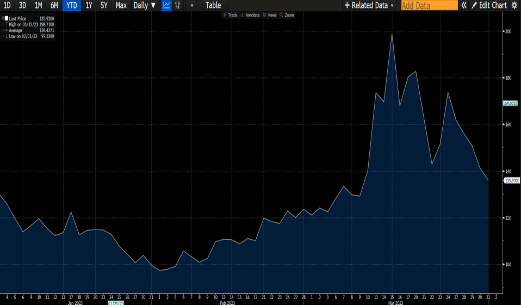
As you can see, the last couple of weeks have been a wild ride.
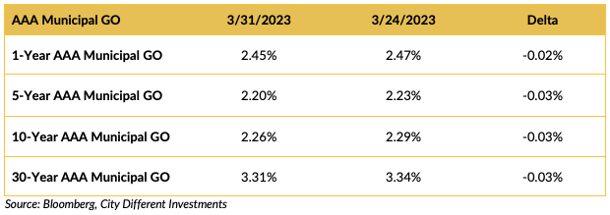
For this past week, the municipal market and the Treasury look completely disconnected. Yields came down in the municipal markets on the margin.
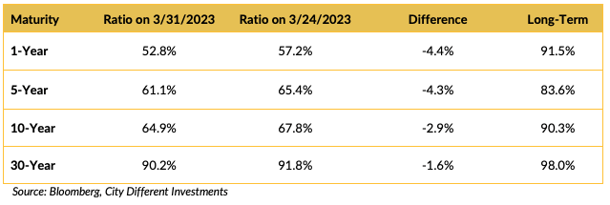
Relative to the Treasury market, municipal bonds got more expensive (as indicated by the decrease in the yield ratio).
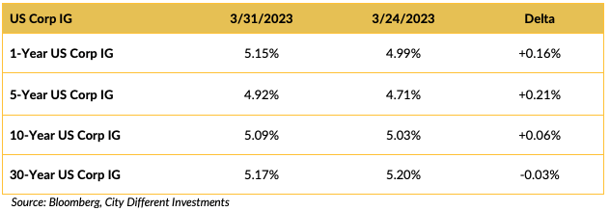
Yield in the investment grade (IG) corporate market moved higher, making credit more interesting.
THIS WEEK IN WASHINGTON
.png?width=1920&name=graphs%20in%20order%20(1).png)
The big news over the weekend came from OPEC+ announcing a surprise cut in oil production of more than one million barrels a day. The cartel is trying to preserve its price premium. Saudi Arabia will cut its oil production by 500,000 barrels a day. Last year, President Biden visited Saudi Arabia. The announced cut could create tension between both countries again.
WHAT, ME WORRY ABOUT INFLATION?
Headline CPI for February stands at 6.0% and Core CPI at 5.5% with real rates in the middle and long end still negative.
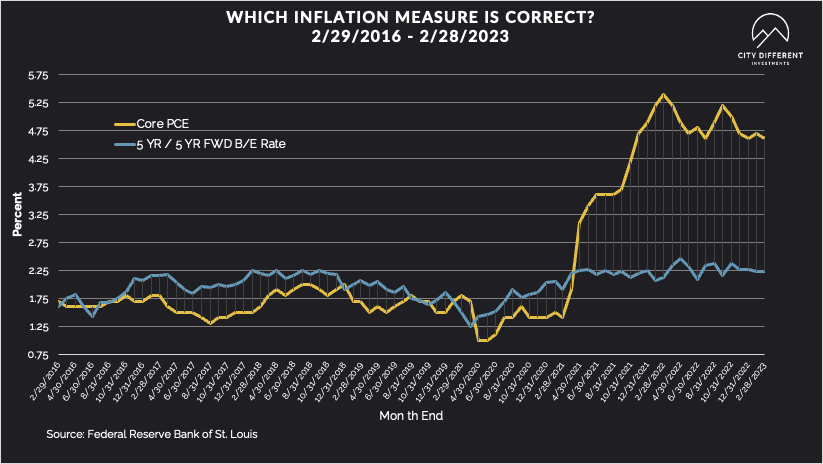
The 5-year Breakeven Inflation Rate ended Friday at 2.24%, 14 basis points higher than the March 17 closing of 2.10%. The 10-year Breakeven Inflation Rate ended the week at 2.24%, 1 basis point higher than last week’s observation of 2.23%.
MUNICIPAL CREDIT
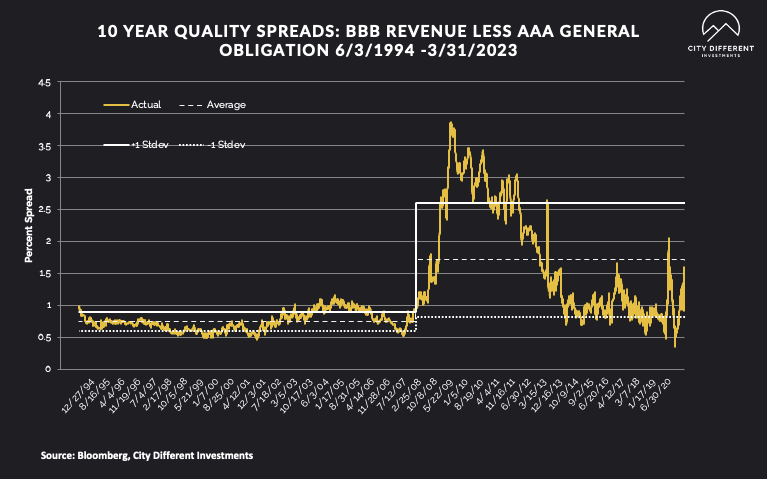 Based on our calculations, 10-year quality spreads (AAA vs. BBB) were tightened on the week (0.96%). The long-term average is 1.71%. By our way of thinking, lower quality securities are still not attractive.
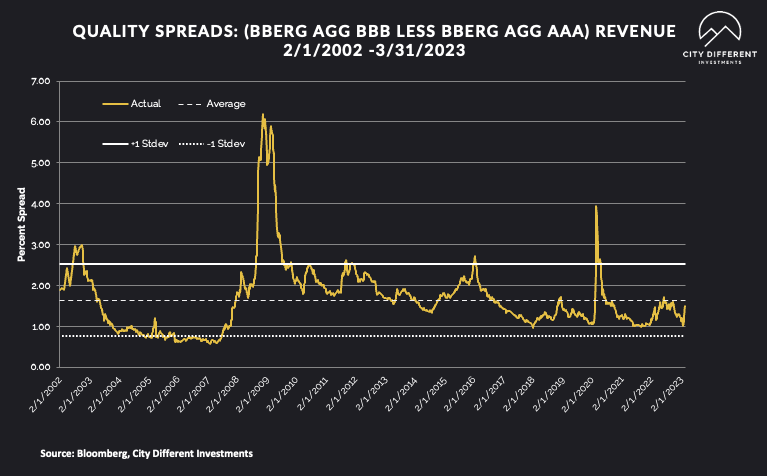
Quality spreads in the taxable market ended the week at 1.32%, 15 basis points lower than last week’s 1.47%.
WHERE ARE FIXED-INCOME INVESTORS PUTTING THEIR CASH?
Money Market Flows (millions of dollars)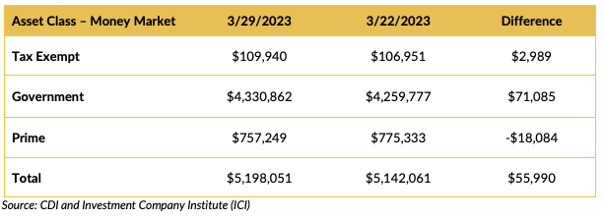
Money market funds saw positive cash flows last week, especially government money market funds.
Mutual Fund Flows (millions of dollars)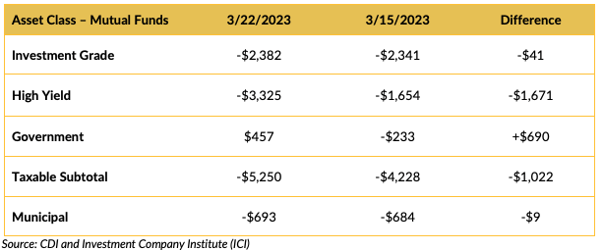
High Yield mutual funds show the nervousness in the market surrounding the banking turmoil.
ETF Fund Flows (millions of dollars)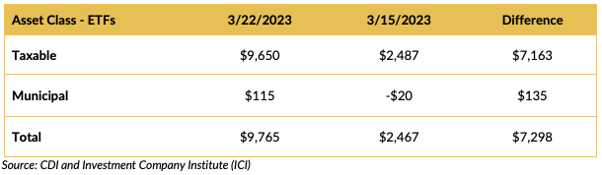
ETF fund flows for the week of March 22 returned to positive for both taxable and municipal bonds.
SUPPLY OF NEW ISSUE MUNICIPAL BONDS
Estimates for next week’s new issue supply are around $5.7 billion.
Total new issuance supply figures of $10 billion or more usually indicate weakness in new issue supply pricing (higher yields).
CONCLUSION
Last week was a return to normalcy for the banking sector, with various asset classes seeing positive fund flows. But is an inflation rate above 2% our new reality? That is the question we are grappling with as the Federal Reserve runs out of rate hikes.
IMPORTANT DISCLOSURES
The information and statistics contained in this report have been obtained from sources we believe to be reliable but cannot be guaranteed. Any projections, market outlooks or estimates presented herein are forward-looking statements and are based upon certain assumptions. Other events that were not taken into account may occur and may significantly affect the returns or performance of these investments. Any projections, outlooks or assumptions should not be construed to be indicative of the actual events which will occur. These projections, market outlooks or estimates are subject to change without notice.
Please remember that past performance may not be indicative of future results. Different types of investments involve varying degrees of risk, and there can be no assurance that the future performance of any specific investment, investment strategy, or product or any non-investment related content, made reference to directly or indirectly herein will be profitable, equal any corresponding indicated historical performance level(s), be suitable for your portfolio or individual situation, or prove successful. Due to various factors, including changing market conditions and/or applicable laws, the content may no longer be reflective of current opinions or positions.
All indexes are unmanaged, and you cannot invest directly in an index. Index returns do not include fees or expenses. Actual portfolio returns may vary due to the timing of portfolio inception and/or investor-imposed restrictions or guidelines. Actual investor portfolio returns would be reduced by any applicable investment advisory fees and other expenses incurred in the management of an advisory account.
You should not assume that any discussion or information contained herein serves as the receipt of, or as a substitute for, personalized investment advice from City Different Investments. To the extent that a reader has any questions regarding the applicability above to his/her individual situation or any specific issue discussed, he/she is encouraged to consult with the professional advisor of his/her choosing. City Different Investments is neither a law firm nor a certified public accounting firm and no portion of this content should be construed as legal or accounting advice.
A copy of City Different Investments' current written disclosure statement discussing our advisory services and fees is available for review upon request.
Unless otherwise noted, City Different Investments is the source of information presented herein.
A description of the indices mentioned herein are available upon request.