

WEEK ENDING 1/13/2023
Highlights of the week:
- CPI Edges down for December 2022
- Disconnect between the Federal Reserve and Markets view on Inflation
- February Fed Hike speculated at 25bps
A CITY DIFFERENT TAKE
The Consumer price index or CPI came down to 6.5% from 7.1% on a year-over-year basis. A reminder to our readers that this is significantly lower than what we saw in June of 2022, where CPI stood tall at 9.1%. This is particularly interesting because CPI is the lowest since October 2021. The same can be said for Core CPI, which fell to 5.7% from 6% in the prior month.
If you look underneath the surface, energy prices have come down 4.5% in the last six months. The biggest culprit driving core inflation continues to be shelter. Even though home and rent prices are moderating, they remain high.
With this backdrop, the consensus has the February FOMC meeting poised for a 25-bps rate hike.
Both equity and fixed income market bulls are out. The two salient points of argument for them
- Peak inflation is behind us (9% in June 2022)
- The Fed is closer to the tail end of its new terminal rate
Here at CDI, we have maintained the stance throughout the rate hike that Headline CPI will end up in the 3%-3.5% range. Multiple risks still need to be solved in the global and U.S. economy. Our base case scenario thus is one of choppy growth, inflation caused by China reopening, and continued elevated job openings. JOLTS data shows a gap of 10.5 million jobs. The labor market bull refuses to roll over. The tight labor market will continue the wage pressure. In addition, a strong Fed supports a hike-and-hold strategy for 2023. Federal reserve minutes continue to show no support for easing financial conditions. Several officials have said that Fed won’t cut interest rates this year.
Meanwhile, the market reading shows optimism. Baked into this optimism is a Fed pause in rate hikes by mid-year to even a rate cut by the end of the year. The same can be seen in the University of Michigan Consumer Sentiment index. This Index increased to 64.6. The increase has been attributed to the favorable assessment of personal finance, rising income, and a slowdown in inflation. For now, the market is confident that there is a durable decline in inflation.
CHANGES IN RATES
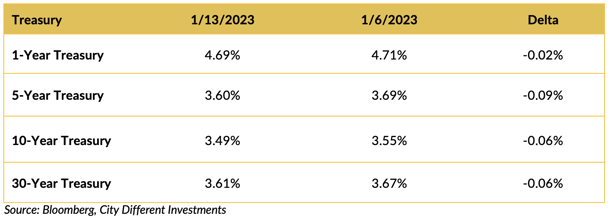
The chart above shows Treasury yields decreasing over the week ending 1/13/2023. This week's CPI report gave the Treasury bulls something to cheer about. The slope of the Treasury curve was virtually unchanged over the period.
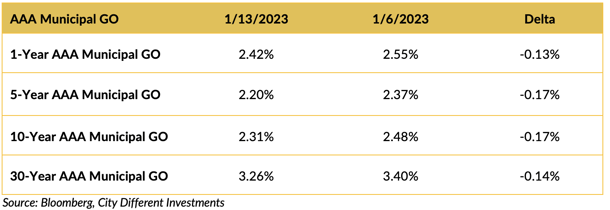
Yields in the municipal market moved lower over the period, and the January effect is taking hold.
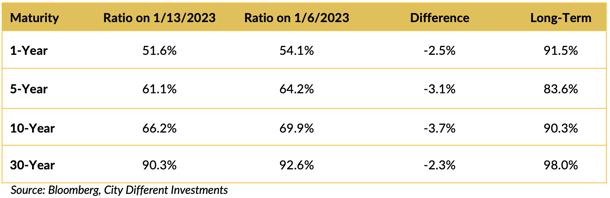
Most muni/Treasury ratios were lower over the period (the second week in a row). The long-awaited January effect is in full impact. Our skepticism is misplaced this year. The next question is, how long will it last?
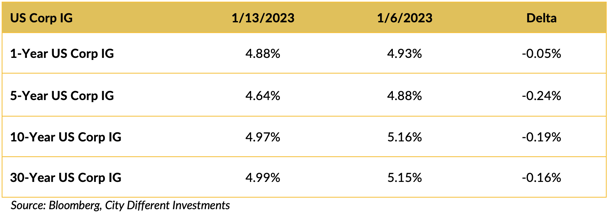
Investment grade yields also moved lower last week.
THIS WEEK IN WASHINGTON
.png?width=1920&name=graphs%20in%20order%20(1).png)
Happy Martin Luther King Day. Much is happening in Washington this week. The House finally has a new speaker in the form of Kevin McCarthy. His first line of action is a debt ceiling bill and cut back on Federal spending. Treasury secretary Janet Yellen asked Congress to raise the debt ceiling ASAP. The government is projected to hit its $31.4 trillion borrowing limit by Jan 19. After this date, the Treasury will have to implement extraordinary measures to ensure cash flow until early June. In other news, House Republicans are seeking an investigation into classified documents found at President Biden’s Delaware home.
WHAT, ME WORRY ABOUT INFLATION?
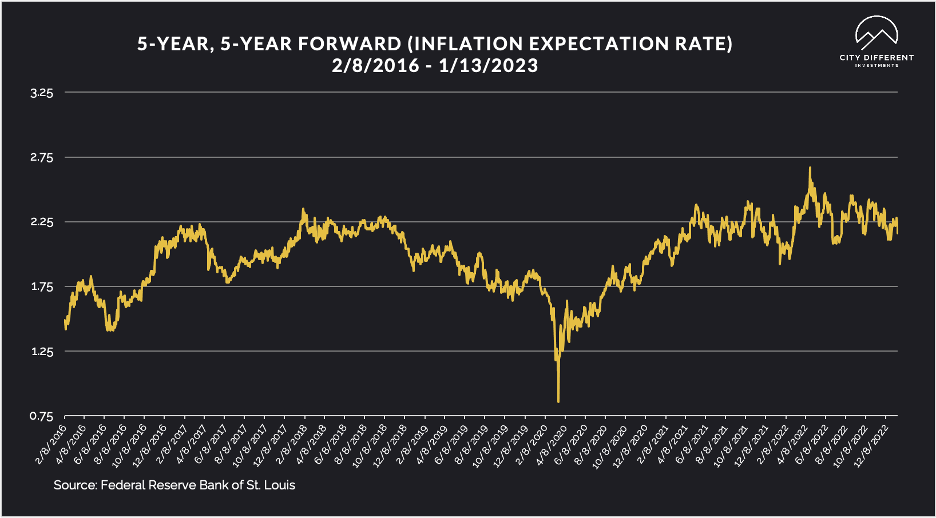
The 5-year Breakeven Inflation Rate ended Friday at 2.16%, 8 basis points lower than the January 6th closing of 2.24%. The 10-year Breakeven Inflation Rate ended the week at 2.18%, three basis points lower than the January 6th observation of 2.21%.
MUNICIPAL CREDIT
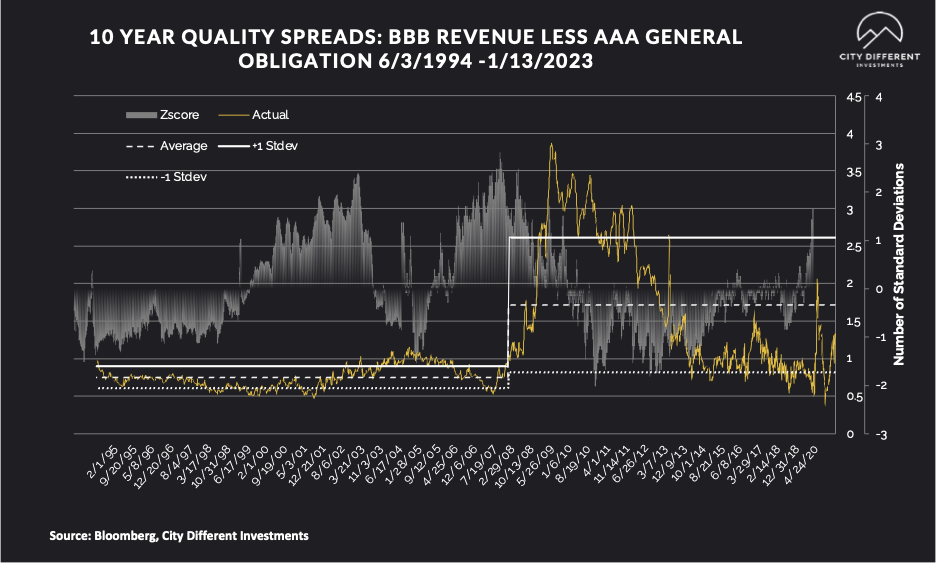
10-year quality spreads (AAA vs. BBB), as measured on January 13th, were at 1.31%, two basis points lower than the January 6th reading of 1.33% and still below the long-term average of 1.72%. This reading is at the lower end of the fair territory (as we define it). We still do not think that investors are “getting paid” to take credit risk with forecasts of a recession on the horizon (even though we believe the likelihood of a significant recession is low). We would need quality spreads to move into the upper portion of the fair territory before beginning a strategic position.
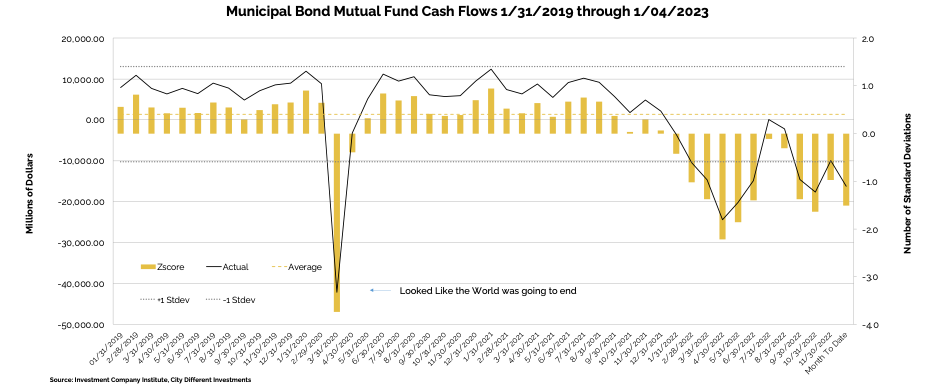
WHY IS THE MUNICIPAL MARKET BEHAVING THIS WAY?
Various sources are used to report cash flows related to municipal bond mutual funds and ETFs, all reporting at different times. The source we have chosen to use is the Investment Company Institute (I.C.I.). The I.C.I. reported weekly cash flows from municipal bond mutual funds of -$3.2 billion for the period ending January 4 compared to -$3.4 billion from the week of December 28.
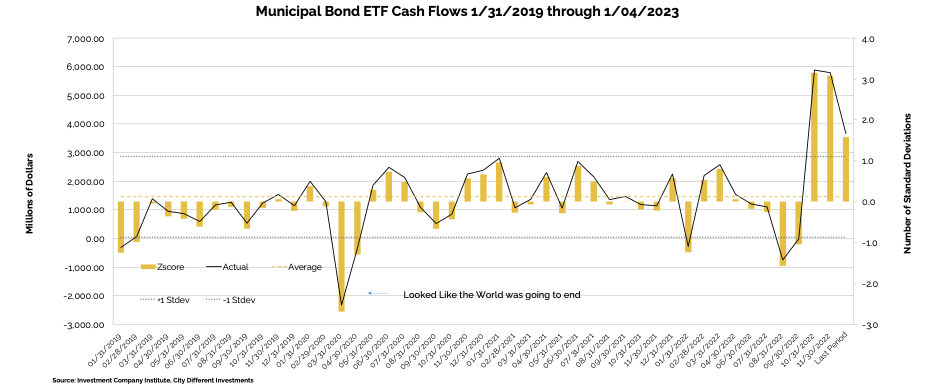
Municipal bond ETF cash flows for the same combined period were +$864 million, compared to +$678 million the week of December 28.
In its Municipal Morning Intelligence newsletter dated January 13, 2023, JP Morgan commented on cash flow data, stating that:
“Lipper reported combined weekly and monthly outflows of $2.7bn for the period ending January 11, increasing YTD outflows to $4.8bn. High Yield funds recorded $788mn of inflows, Long Term funds saw $361mn of inflows, while Intermediate funds saw $1.4bn of outflows. Municipal ETFs registered $454mn of inflows.”
SUPPLY OF NEW ISSUE MUNICIPAL BONDS
The new issue supply is slowly coming to life this week. According to JP Morgan, “Next week, we expect the first elevated supply week of the year totaling $9.1bn, or 123% of the 5yr equiv week avg ($7.4bn). We anticipate tax-exempt supply of $8.9bn (163% of avg), and taxable/corp cusip supply of $287mn (14% of the avg).”
CORPORATE INVESTMENT GRADE AND HIGH YIELD OVERVIEW
In its weekly "Credit Connection,” dated January 13, 2023, Wells Fargo commented:
“Half tight or half loose? With markets rallying into the new year financial conditions have continued to re-loosen following last year’s significant tightening – for example Bloomberg’s measure shows about 50% retracement. Importantly roughly one-third of that rebound occurred over the last month – i.e. since the Dec 14 FOMC meeting. This is relevant as the Minutes reported the Committee warned that “unwarranted easing in financial conditions” would be counterproductive.
Bringing the hammer in Feb. It seems easy to conclude the Fed views current financial conditions quite counterproductive for their mission here and needs to bring the hammer (send a message) in Feb. Of course with several Fed speakers recently indicating preference for only a 25bps rate hike - instead of 50bps – presumably this would instead be a message for Fed Chair Powell to deliver during the press conference. While there has been a lot of discussion about the disconnect between the Fed’s dot plot indicating north of 5% by the end of the year and market pricing something much less, that gap is not new and has remained range-bound the past three months. What changed more is a material decline in long term interest rates , which implies the market pricing in a more benign outlook for inflation – consistent with the re-loosening of financial conditions.
Winter is coming. Still one of the Fed’s preferred measures of inflation – core services ex. shelter -remains elevated and actually increased on a YoY basis. During all of this we sense the probability of US recession is little changed but the perception of expected severity has diminished. The 1s/10s Treasury curve – which our economists judge the most reliable predictor of recession – remains max inverted at -120bps. Moreover the longer this stays inverted – and it has since July – the more severe the downturn historically. So fade the recent rally in risk assets with the most immediate catalyst being negative guidance for 2023 during this earnings reporting season. While the Fed looks destined to pause sometime in 1H23 it seems just as likely they are later forced to restart the hiking cycle as the scenario they cut rates. Alongside other significant risks this means we continue to look for significant widening of credit spreads.”
CONCLUSION
Both headline and core CPI for December has come down. The federal reserve has made remarkable progress since June 2022, with headline CPI down from 9% to the current 6.5% level. The market is exuberant and sees a possible rate cutback towards the end of the year. We do not. We see an extended raise-and-hold strategy. There continues to be multiple headwinds to the national and global economy for 2023.
IMPORTANT DISCLOSURES
The information and statistics contained in this report have been obtained from sources we believe to be reliable but cannot be guaranteed. Any projections, market outlooks or estimates presented herein are forward-looking statements and are based upon certain assumptions. Other events that were not taken into account may occur and may significantly affect the returns or performance of these investments. Any projections, outlooks or assumptions should not be construed to be indicative of the actual events which will occur. These projections, market outlooks or estimates are subject to change without notice.
Please remember that past performance may not be indicative of future results. Different types of investments involve varying degrees of risk, and there can be no assurance that the future performance of any specific investment, investment strategy, or product or any non-investment related content, made reference to directly or indirectly herein will be profitable, equal any corresponding indicated historical performance level(s), be suitable for your portfolio or individual situation, or prove successful. Due to various factors, including changing market conditions and/or applicable laws, the content may no longer be reflective of current opinions or positions.
All indexes are unmanaged, and you cannot invest directly in an index. Index returns do not include fees or expenses. Actual portfolio returns may vary due to the timing of portfolio inception and/or investor-imposed restrictions or guidelines. Actual investor portfolio returns would be reduced by any applicable investment advisory fees and other expenses incurred in the management of an advisory account.
You should not assume that any discussion or information contained herein serves as the receipt of, or as a substitute for, personalized investment advice from City Different Investments. To the extent that a reader has any questions regarding the applicability above to his/her individual situation or any specific issue discussed, he/she is encouraged to consult with the professional advisor of his/her choosing. City Different Investments is neither a law firm nor a certified public accounting firm and no portion of this content should be construed as legal or accounting advice.
A copy of City Different Investments' current written disclosure statement discussing our advisory services and fees is available for review upon request.
Unless otherwise noted, City Different Investments is the source of information presented herein.
A description of the indices mentioned herein are available upon request.