.png)

WEEK ENDING 4/10/2026
- A fragile ceasefire was announced in Iran, but the Strait of Hormuz remains closed.
- A backward look at inflation shows it is still sticky, above the Fed’s 2.00% target.
- A more current inflation reading shows the economic impact of the Iran Incursion.
- Anthropic’s Mythos can uncover weak points in “every major operating system and web browser.”
- NASA Delivers!! Space exploration is still wondrous and hopeful!
A CITY DIFFERENT TAKE
Iran Incursion:
Hopes of a two-week ceasefire announced on Tuesday spurred a relief rally across both equity and fixed-income markets. The S&P 500 index closed on Monday night at 6616.85 and rallied to 6,782.81 to close on Wednesday, a 2.5% increase. The 10-year Treasury security closed on Monday at 4.335% and finished Tuesday at 4.295%, a rather muted rally. The ceasefire is tenuous at best; Iran issued a ten-point plan that the President deemed a “workable basis.”
Amid the tenuous two-week ceasefire between the U.S. and Iran, it is unclear what exactly is in the 10-point plan from the Iranian government that President Trump deemed a “workable basis” on which to negotiate. How many of the ten points are actually "workable"?
Talks began in Pakistan this weekend. Major sticking points include.
- The ceasefire status of Lebanon
- The ceasefire status of the Strait of Hormuz
- Iran’s Nuclear desires
- The status of Iran’s regional allies and proxies (Hezbollah, Houthis, and Hamas
- Sanctions Relief Points of Contention.
All this means that the price of oil, equity markets, and fixed income markets will react to these headlines in the future. Buckle up for more volatility!
As of Sunday Morning:
- “Vice President JD Vance, who led the U.S. delegation during the marathon talks in Pakistan, said the two sides failed to reach an agreement because Tehran refused to give up its pursuit of nuclear weapons. He departed for the U.S. early Sunday.”
- “Iran’s lead negotiator said Washington had failed to earn its trust, while its state broadcaster blamed “unreasonable demands” by the U.S. on the nuclear issue and the Strait of Hormuz. Tehran said no further talks had been arranged.”
- “President Trump said the U.S. Navy would begin blockading ‘any and all ships trying to enter or leave the Strait of Hormuz,” after peace talks with Iran collapsed this weekend. Less than a week into a cease-fire between the two countries, he threatened that the U.S. military would “finish up the little that is left of Iran.”
- “In Iran, meanwhile, state media reported that navy special forces have deployed to the southern coast, signaling readiness for a potential invasion by American troops.” Not Good News
Looks like all signs point to volatility next week! Maybe not, who can tell!
February PCE Inflation:
February Core PCE inflation was released on Wednesday, 4/8/2026, and it came in at 3.0%, right on expectations but slightly lower than January’s 3.1%. This number was backward-looking and did not reflect the price increases of the Iran incursion. Core PCE is the Fed’s favorite inflation reading and has been (still is) sticky and above the Fed’s 2.00% target.
March CPI:
Another inflation release came out on Friday, the March CPI. The reading is more sensitive to the price increase of energy costs due to the Iran incursion. We normally don’t dwell on the monthly readings, but the March CPI monthly readings encapsulate the partial costs of the Iran incursion. Month-over-month CPI came in at 0.9%, spot on expectations, but 0.6% higher than February’s reading. The culprit for the increase is evident in the comparison between March CPI and March Core CPI: 0.9% versus 0.2%. Core inflation readings are calculated without food and energy costs. The old joke about core inflation readings and why economists like them is that economists don’t eat or drive. It is not so funny in this situation because, given the cost of gas and food, many of us will be driving and eating less.
Anthropic’s Mythos:
For those worried about Artificial Intelligence, here is another nugget to worry over.
“Anthropic's latest AI technology, called Mythos, is so powerful at revealing software vulnerabilities that the company is afraid to release the model publicly lest it fall into the hands of bad actors.
Rather than releasing Mythos to the public, Anthropic is sharing the tech with a select group of major companies, including Amazon, Apple, Cisco, JPMorgan Chase, and Nvidia, so they can test the model and strengthen their own systems against cyberattacks. Called Project Glasswing, the effort is aimed at helping key companies harden their defenses before hackers get access to Mythos or similar AI models, according to Anthropic.” Sorry Dave
This all recalls a famous line from 2001: A Space Odyssey, “where the AI/robotic system Hal (the spaceship’s computer) calmly challenges humanity”:
"I'm sorry, Dave, I'm afraid I can't do that." Hal Again
The US Consumer:
The US consumer is not feeling great. Consumers are important because 70% of US GDP is generated by consumers. The University of Michigan Consumer Sentiment Index for April was 47.6% (well below the long-term average of 78.53, as CDI calculates it), which is not surprising given what is happening in the world these days. There is a large disconnect between what the consumer feels and other financial data releases. For example, Bloomberg’s US financial conditions index for April was 0.76, well above its long-term average of -0.24%. Inflation and employment opportunities help explain this dichotomy. Maybe it’s time to break out Arthur Okun’s misery index, which measures the impact of economic distress on average citizens by adding the seasonally adjusted unemployment rate to the annual inflation rate. The April reading is 7.3, below the long-term average (as CDI calculates it) of 8.34. It will probably go higher because the full impact of the energy cost increases is not yet reflected in the annual inflation numbers.
Artemis II
Speaking of space (hard to find a segway), finally, some good news. NASA delivers again!! The crew of Artemis II safely returned to Earth from their mission around the moon. One can only sum up the mission as wondrous and hopeful for humanity. That is, if we don’t destroy ourselves first!
CHANGES IN RATES
TreasuryMarket
Treasury yields continued to rally lower. The slope of the Treasury curve between 2 and 10 years was pretty much unchanged over the week. Hope of a Fed cut in short-term interest rates has been dashed. The highest probability of a rate cut was pushed out to the December meeting, with an implied probability of a 0.25% rate cut at 15.6% as of the close of business on Friday. A month ago, that implied probability number was 28.9%, and it followed four monthly implied probability readings of 20+%.
Municipal Market
The Muni market followed the Treasury market in the yield rally. The 2/10 spread for last week was 62 basis points, three basis points lower than last week.
Selected Municipal AAA General Obligation Bond / Selected Treasury Bonds Yield Ratio
Municipals outperformed their Treasury equivalents last week. The municipal/Treasury ratios are significantly lower across the curve this week.
Investment Grade Corporates
IG corporate yields moved lower on the week. But both the Treasury and municipal markets lagged.
THIS WEEK IN WASHINGTON
The biggest news out of DC is the administration’s budget requests.
“Not only has the administration of President Donald Trump requested a “supplemental” $200 billion in additional defense spending to replenish munitions and provide more funding for the Iran war in the current fiscal year… but its recently released outline for next year asks for a stunning increase in defense expenditures, to $1.5 trillion from $1.1 trillion.”
Does this seem unreasonable? Well, here is some more good news from Barron’s:
“The administration’s outline of the fiscal 2027 budget also brings back an old friend from the 1980s, Rosie Scenario. The projections from the Office of Management and Budget show the budget gap gradually shrinking as a percentage of gross domestic product, from over 6% currently to under 3% of GDP by 2036. The total publicly held U.S. debt would rise from 100% of GDP in fiscal 2025 to 103% in 2029, before easing to 94% by 2036.
OMB’s projections are based on an assumed real U.S. economic growth rate of 3% annually—half again the Federal Reserve’s long-term sustainable estimate of 2% and two-thirds higher than the nonpartisan Congressional Budget Office’s long-term 1.8% growth estimate. Spending like a drunken Sailor
No wonder the Federal government cannot afford to spend on Medicare, Medicaid, and child care:
“President Donald Trump on Wednesday said it’s “not possible” for the federal government to fund Medicare, Medicaid, and childcare costs, arguing that it should be up to the states to “take care” of those programs while the federal government focuses on military spending.” New Social Contract?
WHAT, ME WORRY ABOUT INFLATION?
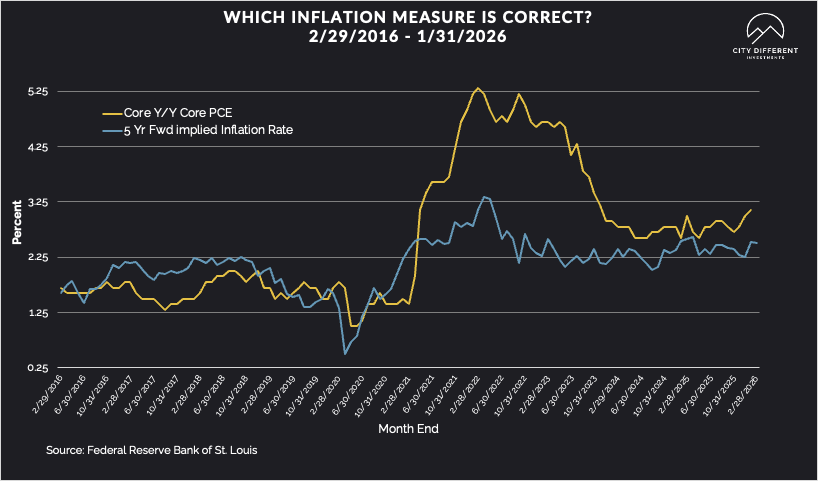
The 5-year Breakeven Inflation Rate finished the week of April 10 is 2.58%, three basis points lower than April 3 at 2.61%. The graph above contrasts a 5-year Breakeven Inflation Rate tracked weekly. This is the market implied inflation rate. We track this relative to core PCE, the Fed’s favorite inflation measure. The 10-year Breakeven Inflation Rate finished the period at 2.36%, the same as last week.
MUNICIPAL CREDIT

Last week's 10-year quality credit spread between BBB revenue bonds and AAA general obligation bonds was 0.81%, lower by 3 basis points for the week. The historical average credit spread is at 1.68%.
TAXABLE CREDIT

Investment-grade spreads for the past week were at 102 basis points, 3 basis points lower than the previous week. The long-term average for investment grade is 1.56%. High-yield credit spreads are 2.72%, significantly lower than last week by 24 basis points.
WHERE ARE FIXED-INCOME INVESTORS PUTTING THEIR CASH?
Money Market Flows (millions of dollars)
Money market fund flows were positive overall last week.
Mutual Fund Flows (millions of dollars)
Mutual fund flows were negative overall, with few bright spots.
ETF Fund Flows (millions of dollars)
Net ETF flows were negative in the taxable category and positive for the municipal category through all categories.
SUPPLY OF NEW ISSUE BONDS
This week, the supply of new-issue municipal bonds is estimated at around $9.3 B. This should be a manageable amount. The municipal markets come under pressure when new-issue supply exceeds $10 B.
CONCLUSION
The week ending April 10th illustrated that volatility is not always in one direction. The failed ceasefire talks in Pakistan promised more market volatility next week (well, that is from where we sit on Sunday morning)—just a point of context: the Vietnam peace talks began in 1968 and concluded on 1/27/1973. Vietnam was a much longer conflict, but bargaining for peace can be tricky. On the home front, current indicators (jobs and inflation) suggest the Fed’s focus may shift from maximum employment to stable prices. We pose this theory not because of the last job’s reading (one number does not make a trend), but because of the 3-month average of 72,000 non-farm payroll jobs. This number is well above any of the monthly job-creation numbers discussed to maintain current employment levels. Inflation, on the other hand, has been sticky, looking behind us, and promises to be higher moving forward.
On the bright side, thanks to Artemis II, we can look to the stars and, as Theodore Roosevelt said, “Dare Greatly”.
IMPORTANT DISCLOSURES
The information and statistics contained in this report have been obtained from sources we believe to be reliable but cannot be guaranteed. Any projections, market outlooks or estimates presented herein are forward-looking statements and are based upon certain assumptions. Other events that were not taken into account may occur and may significantly affect the returns or performance of these investments. Any projections, outlooks or assumptions should not be construed to be indicative of the actual events which will occur. These projections, market outlooks or estimates are subject to change without notice.
Please remember that past performance may not be indicative of future results. Different types of investments involve varying degrees of risk, and there can be no assurance that the future performance of any specific investment, investment strategy, or product or any non-investment related content, made reference to directly or indirectly herein will be profitable, equal any corresponding indicated historical performance level(s), be suitable for your portfolio or individual situation, or prove successful. Due to various factors, including changing market conditions and/or applicable laws, the content may no longer be reflective of current opinions or positions.
All indexes are unmanaged, and you cannot invest directly in an index. Index returns do not include fees or expenses. Actual portfolio returns may vary due to the timing of portfolio inception and/or investor-imposed restrictions or guidelines. Actual investor portfolio returns would be reduced by any applicable investment advisory fees and other expenses incurred in the management of an advisory account.
You should not assume that any discussion or information contained herein serves as the receipt of, or as a substitute for, personalized investment advice from City Different Investments. To the extent that a reader has any questions regarding the applicability above to his/her individual situation or any specific issue discussed, he/she is encouraged to consult with the professional advisor of his/her choosing. City Different Investments is neither a law firm nor a certified public accounting firm and no portion of this content should be construed as legal or accounting advice.
A copy of City Different Investments' current written disclosure statement discussing our advisory services and fees is available for review upon request.
Unless otherwise noted, City Different Investments is the source of information presented herein.
A description of the indices mentioned herein is available upon request.