.png)

WEEK ENDING 4/3/2026
- Understanding the ‘new’ employment numbers
- Correlation between oil and inflation
- The Strait of Hormuz is the only number that matters
A CITY DIFFERENT TAKE
The labor market looks resilient on the surface, but appearances can be misleading. Breakeven job growth has collapsed toward zero due to immigration, so the unemployment rate staying low tells you almost nothing about the true health of hiring or economic activity, and the Fed is watching inflation, not jobs, as its binding constraint right now. The employment picture right now is genuinely confusing because two things are true at once and seem to contradict each other. Let’s untangle it.
The headline: 178,000 jobs added in March
That sounds robust, and compared to February's 133,000 decline, it is a dramatic swing. But the first thing to understand is that most of that swing was mechanical. A healthcare strike ended, the weather improved, and construction bounced back, adding 55,000 jobs from February to March, while leisure and hospitality added 57,000. Those are not new jobs created by economic expansion; they are jobs that temporarily disappeared and came back. Strip those out, and the underlying trend is much more modest.
The breakeven problem: this is the key concept
In a normal economy, the labor force grows because the population grows through births, aging into working years, and immigration. To keep unemployment stable, you need to create enough jobs to absorb all those new workers. That is called the breakeven level of job growth.
Historically, breakeven was around 100,000 to 150,000 jobs per month, a number everyone was trained to use. Above breakeven, unemployment falls; below breakeven, unemployment rises.
That framework is now broken. Immigration has collapsed, and the population entering the workforce has slowed dramatically. Federal Reserve researchers and Dallas Fed researchers both published estimates this week saying breakeven job growth is now close to zero, possibly negative. The Dallas Fed found that net authorized immigration was already running at negative 55,000 per month in the second half of 2025. Powell himself said in his last press conference that breakeven could be around zero.
What does this mean in plain English? The economy could create no new jobs in a given month, and unemployment would not rise. It could produce negative jobs, and unemployment might still hold steady or even fall.
So, is 178,000 strong or not? In absolute terms, 178,000 is a solid print. But relative to a near-zero breakeven, it is almost irrelevant for the unemployment trajectory. The unemployment rate fell to 4.26% in March — a nine-month low. That decline happened not primarily because 178,000 jobs were created but because the labor force itself is barely growing due to immigration collapse, and the participation rate ticked down.
The diffusion index, which measures how broadly job gains are spread across industries, jumped to 56.8, a three-year high. That is a genuine positive signal about breadth. But the trailing three and six-month NFP averages are 68,000 and 15,000, respectively, after running negative throughout the fourth quarter of 2025. The trend is recovering, but from a very weak base.
Two things are happening simultaneously
First, monthly payrolls have become dramatically more volatile. The standard deviation of monthly job prints is now above the typical range seen during economic expansions. That means any single month, positive or negative, carries less signal than it used to. February's 133,000 decline was not a recession signal. March's 178,000 gain is not a boom signal. The noise has increased.
Second, the composition of job growth is distorted. Healthcare has been carrying the labor market. When healthcare is strong, and everything else is flat or declining, you have a labor market that looks fine in aggregate but reflects a narrow base of essential-service hiring rather than broad economic expansion.
What this means for the Fed
The Fed cannot use the unemployment rate as a clean signal anymore. If breakeven is near zero, an unemployment rate of 4.3% could be consistent with an economy that is actually contracting in real activity. Powell knows this, which is why he has shifted to watching inflation expectations and wage growth rather than the unemployment level.
March payrolls clear the way for the April FOMC to hold, which was already expected. The jobs report neither pushes the Fed toward cutting nor toward hiking. It is genuinely neutral from a policy standpoint, which, in this environment, where oil is at $110, and inflation is heading to 3.4% on the March CPI print, means the Fed stays exactly where it is.
CHANGES IN RATES
TreasuryMarket
Treasury yields rallied lower, and the treasury curve flattened by 50.3 basis points. The 7Y was the week's biggest mover at −8.7 bps, followed closely by 5Y and 10Y at −8.4 bps each. The 2Y dropped by −7.0 bps, and the 30Y by −5.7 bps, meaning the long end lagged, slightly flattening the 10s/30s spread. The rally was led by the belly (5Y–10Y), the front end barely reacted (Fed expectations stable), and the long end lagged slightly. Within the broader monthly context, rates are still materially higher than they were a month ago across the curve.
Municipal Market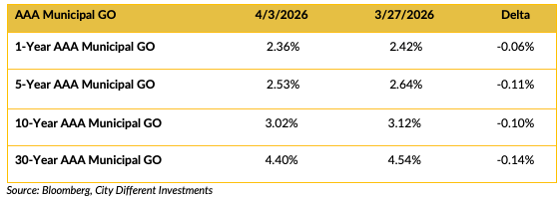
The Muni market followed the Treasury market in the yield rally. The 2/10 spread for last week was 65 basis points, three basis points lower than last week. Municipal yield rallied lower following a cue from the treasury market. It was a shorter holiday week with a smaller issuance calendar, which buoyed the rally. Every maturity tightened, and unlike the earlier dataset that showed a uniform −2 bps, this AAA GO data shows a more natural, graduated move. The long end did the most work:
- 1Y: −6 bps
- 5Y: −11 bps
- 10Y: −10 bps
- 30Y: −14 bps
Selected Municipal AAA General Obligation Bond / Selected Treasury Bonds Yield Ratio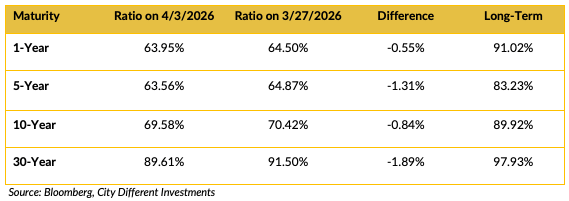
Municipals got expensive this week. Ratios fell across the board week-over-week — Munis got richer relative to Treasuries at every maturity. The short end moved the most, and the long end moved the least.
Investment Grade Corporates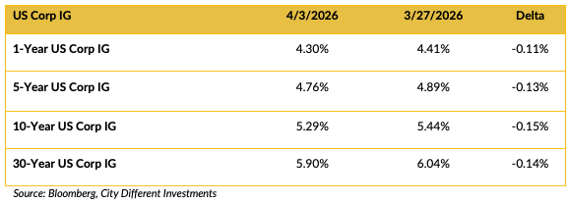
One month ago, on March 3, the IG curve was materially lower in yield, 28 to 40 basis points lower across the belly. The 3- to 5-year range has risen by 39 to 40 basis points over the past month. That is a significant repricing driven by the energy shock from the Strait of Hormuz and the resulting inflation concern that pushed rates higher through most of March before this week's partial reversal.
The 2-year IG at 4.39% versus the 10-year at 5.30% yields a 91-basis-point 2s10s spread. A 10-year versus a 30-year is only 61 basis points. The curve is steep in the front-to-belly and flat in the belly-to-long-end. This suggests the market is pricing in eventual rate cuts but not soon and does not believe long-term inflation expectations have become unanchored despite the oil shock.
THIS WEEK IN WASHINGTON
The oil market has one variable right now, and it is not OPEC+ production quotas. Traffic through the Strait of Hormuz has collapsed from roughly 135 ships daily before the war to a handful, with Iran controlling passage and showing preferential treatment to vessels from countries it deems friendly. The IEA has called this the largest supply disruption in the history of the energy market. Gulf producers, including Saudi Arabia, the UAE, Iraq, and Kuwait, have collectively cut output by approximately 10 million barrels a day, roughly 10% of global supply. Brent settled near $109 on Friday. OPEC+ approved a symbolic increase of 206,000 barrels a day for May — a number that is essentially theoretical while the strait remains throttled.
The geopolitical backdrop deteriorated further this week. US forces conducted a two-day rescue operation to retrieve an injured F-15E airman from mountainous terrain in Iran, deploying hundreds of special operations troops and dozens of aircraft. This mission underscored both the operational reach of US forces and the deepening intensity of the conflict. President Trump renewed threats to target Iranian power plants and bridges, warning that Tehran would face severe consequences if the Strait of Hormuz were not reopened, and signaled that a 10-day peace deadline was nearing expiration. Iran has shown little inclination to accept US terms and has put forward its own conditions, most of which remain incompatible with Washington's stated objectives. The human cost continues to mount, with more than 5,000 lives lost across the conflict. Domestically, energy prices remain a visible and politically sensitive pressure point for American consumers, and the calendar is moving toward a midterm election cycle that historically sharpens the executive branch's sensitivity to economic conditions. The core tension is straightforward: the administration's public posture reflects maximum pressure, while the underlying path to resolution remains unclear.
The domestic policy backdrop shifted notably this week, independent of the Iran conflict. President Trump removed Attorney General Pam Bondi, the second Cabinet secretary to depart within a month, following the earlier dismissal of Homeland Security Secretary Kristi Noem. Deputy Attorney General Todd Blanche has stepped in as acting Attorney General, with EPA Administrator Lee Zeldin reported as a leading candidate for the permanent role. Separately, Defense Secretary Hegseth removed Army Chief of Staff General Randy George, along with two other senior generals, citing a desire for military leadership more closely aligned with the administration's strategic direction. The timing — mid-conflict, with active operations ongoing — makes these personnel transitions more consequential than a typical Cabinet reshuffle would be in a quieter environment.
WHAT, ME WORRY ABOUT INFLATION?
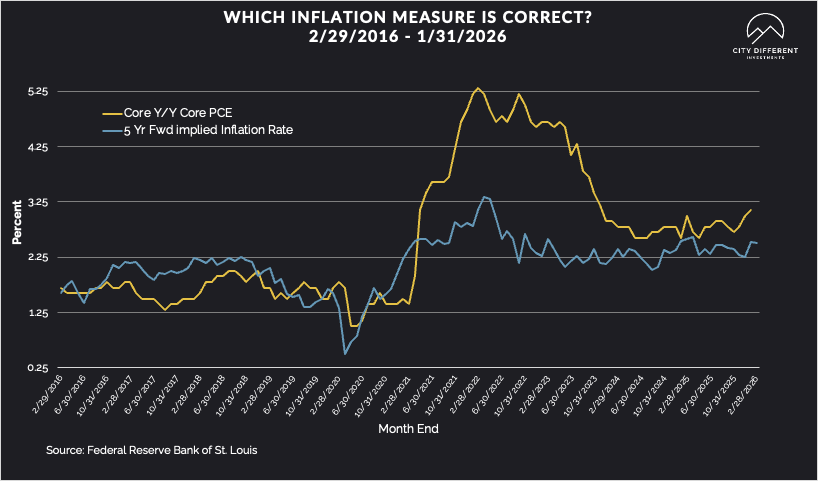
The 5-year Breakeven Inflation Rate finished the week of April 3 is 2.61%, five basis points higher than March 27 at 2.56%. The graph above contrasts a 5-year Breakeven Inflation Rate tracked weekly. This is the market implied inflation rate. We track this relative to core PCE, the Fed’s favorite inflation measure. The 10-year Breakeven Inflation Rate finished the period at 2.36%,5 basis points higher than last week.
Oil and Inflation: A Relationship Worth Questioning
The assumed link between rising crude prices and core inflation is more complicated than the headlines suggest — and the data bears that out. Looking at WTI and core PCE since 1998, the statistical relationship between the two has been unstable at best. An R-squared of roughly 0.13 indicates a weak correlation. It is barely a relationship at all. Crude went from $11 a barrel in 1998 to $146 in 2008 — a thirteen-fold move — and core PCE inflation over that same stretch moved from 1% to 2.5%. Oil did something extraordinary. Inflation responded modestly.
What matters is not the level of oil prices but the speed of the move. In the first half of the 2010s, crude sat comfortably in the $90 to $100 range — multiples above where it had traded the prior decade — and core PCE inflation ran below the Fed's 2% target the entire time. Once absorbed, elevated oil prices stopped being an inflation story. Markets had priced them in, behavior had adjusted, and the economy moved on.
The post-2022 episode adds another layer of nuance. The inflation surge between 2020 and 2022 was driven by global supply disruptions, not energy prices. The subsequent disinflation reflected a supply recovery, not falling crude prices. The co-movement of oil and core PCE over that period may be largely coincidental. Today's inflation stickiness has little to do with what is happening at the wellhead — it reflects resilient aggregate demand. That is an important distinction for fixed-income investors trying to handicap the Fed. If crude stabilizes or retreats, the inflation impulse from energy fades faster than the market currently fears. The key question is duration — how long prices stay elevated, not how high they have gone.
MUNICIPAL CREDIT
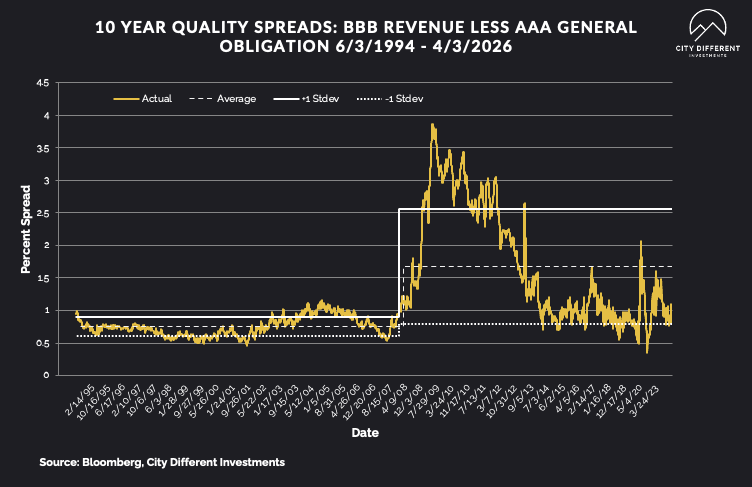
Last week's 10-year quality credit spread between BBB revenue bonds and AAA general obligation bonds was 0.85%, higher by 1 basis point for the week. The historical average credit spread is at 1.68%.
TAXABLE CREDIT
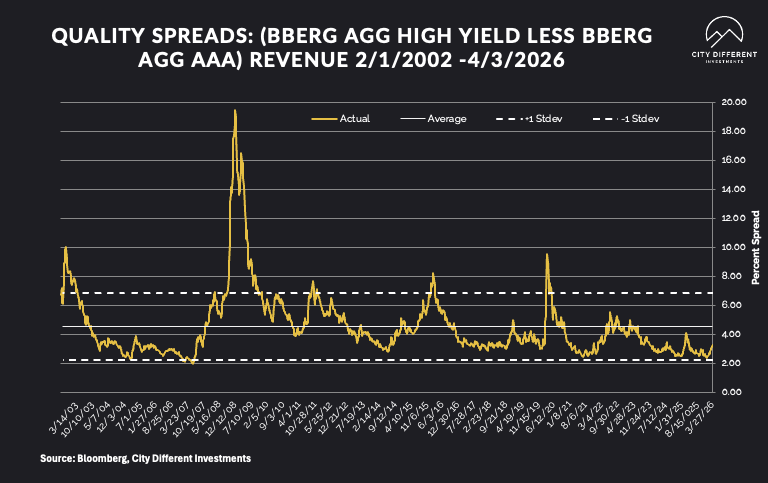
Investment-grade spreads for the past week were at 105 basis points, 6 basis points lower than the previous week. The long-term average for investment grade is 1.56%. High-yield credit spreads are 2.99%, significantly lower than last week by 31 basis points. We do not have a good explanation for this swing reversal. However, when we compare this data to the ICE BofA US High Yield Index, which sits at 3.16%, we are in the realm of similar high-yield credit spreads, which remain at all-time tight levels.
WHERE ARE FIXED-INCOME INVESTORS PUTTING THEIR CASH?
Money Market Flows (millions of dollars)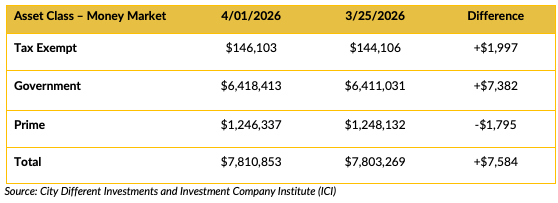
Money market fund flows were down overall last week.
Mutual Fund Flows (millions of dollars)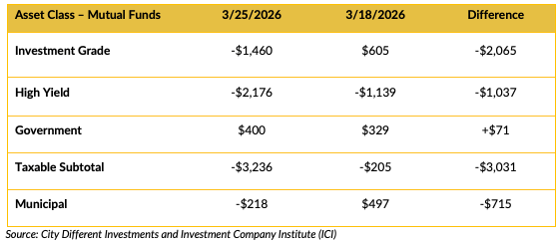
Mutual fund flows were negative across the board last week, except for government funds.
ETF Fund Flows (millions of dollars)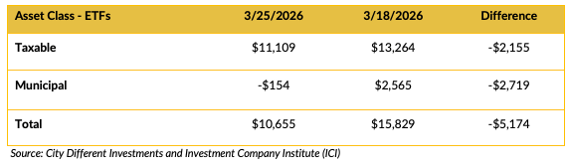
Net ETF flows were positive in total for the week.
SUPPLY OF NEW ISSUE BONDS
Year-to-date long-term tax-exempt supply reached $122 billion, running 15% ahead of first quarter 2025 — which was itself a record at the time — and 46% above the trailing five-year quarterly average. That is not a rounding error. That is a structural shift in borrower behavior.
Taxable municipal issuance tells a different story entirely. At $6 billion, taxable supply is down 26% from the same period last year and sits 65% below the trailing five-year average. Issuers are clearly choosing tax-exempt paper when they can, and the market is absorbing it.
In aggregate, gross supply is tracking around $128 billion for the quarter — up 12% versus the first quarter of 2025 and 28% above the five-year average. The pipeline has been full, and demand has largely kept pace.
On credit composition, high yield has represented approximately 6% of year-to-date tax-exempt issuance, essentially unchanged from 2025 (7%) and 2024 (6%). For context, that proportion peaked at 13% in 2021. Today's supply is predominantly investment grade — a quality profile that matters when assessing the technical backdrop.
The takeaway: borrowers are front-running uncertainty, the tax-exempt market is functioning well, and the credit mix remains disciplined. Supply is a tailwind for price discovery and an opportunity for active managers who know where to look.
CONCLUSION
The week ending April 3rd presented fixed-income investors with a market processing multiple, simultaneous shocks — an active military conflict reshaping global energy flows. This labor market looks stronger than it is once you understand the broken breakeven framework, a Fed that is functionally frozen between two mandates pulling in opposite directions, and a fiscal picture that the term premium in long Treasuries is quietly but honestly reflecting.
The Strait of Hormuz remains the single most consequential variable in global fixed income markets today — more than the Fed and more than payrolls. Until that chokepoint reopens or crude prices break meaningfully lower, the path of least resistance for rates is range-bound at best and higher at worst.
What we do know is this: the United States is absorbing this shock from a structurally stronger position than prior energy crises, and domestic production at 13.6 million barrels a day is a genuine cushion.
IMPORTANT DISCLOSURES
The information and statistics contained in this report have been obtained from sources we believe to be reliable but cannot be guaranteed. Any projections, market outlooks or estimates presented herein are forward-looking statements and are based upon certain assumptions. Other events that were not taken into account may occur and may significantly affect the returns or performance of these investments. Any projections, outlooks or assumptions should not be construed to be indicative of the actual events which will occur. These projections, market outlooks or estimates are subject to change without notice.
Please remember that past performance may not be indicative of future results. Different types of investments involve varying degrees of risk, and there can be no assurance that the future performance of any specific investment, investment strategy, or product or any non-investment related content, made reference to directly or indirectly herein will be profitable, equal any corresponding indicated historical performance level(s), be suitable for your portfolio or individual situation, or prove successful. Due to various factors, including changing market conditions and/or applicable laws, the content may no longer be reflective of current opinions or positions.
All indexes are unmanaged, and you cannot invest directly in an index. Index returns do not include fees or expenses. Actual portfolio returns may vary due to the timing of portfolio inception and/or investor-imposed restrictions or guidelines. Actual investor portfolio returns would be reduced by any applicable investment advisory fees and other expenses incurred in the management of an advisory account.
You should not assume that any discussion or information contained herein serves as the receipt of, or as a substitute for, personalized investment advice from City Different Investments. To the extent that a reader has any questions regarding the applicability above to his/her individual situation or any specific issue discussed, he/she is encouraged to consult with the professional advisor of his/her choosing. City Different Investments is neither a law firm nor a certified public accounting firm and no portion of this content should be construed as legal or accounting advice.
A copy of City Different Investments' current written disclosure statement discussing our advisory services and fees is available for review upon request.
Unless otherwise noted, City Different Investments is the source of information presented herein.
A description of the indices mentioned herein is available upon request.