

WEEK ENDING 3/8/2024
• Impressive employment numbers.• One year anniversary of Silicon Valley Bank’s failure.
• Will the Muni-Treasury ratios come back to their historical averages?
A CITY DIFFERENT TAKE
Strong growth numbers released last Friday showed an impressive gain of 275,000 jobs last month. However, there were downward revisions to prior months due to seasonal weather effects dampening the impact of the strength of the February employment report.
After revision of these numbers, the average hourly earnings and hours worked continue to moderate. The unemployment rate increased by 0.2% and now stands at 3.9%. This is the highest it has been in the last two years. The Federal Reserve is watching the labor market closely. The easing of tight labor conditions in the form of a tick-up in unemployment and a slowdown in wage inflation is a positive move toward a rate cut this summer.
March completes the one-year anniversary of Silicon Valley Bank’s failure. Now lawmakers, regulators, and the market are focusing on risks in commercial real estate loans. The Federal Reserve Vice Chair for Supervision, Michael Barr, is leading the efforts to improve supervision on stress tests and identify risks in commercial real estate after the three regional banks fell last year. For now, the risk surrounding New York Community Bank Corp is labeled as idiosyncratic and not systemic.
CHANGES IN RATES
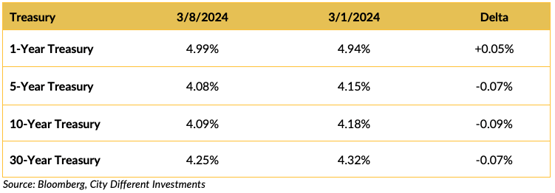
Treasury rates moved significantly throughout all tenors in the curve.
Several of our clients have seen that the municipal / Treasury relationship has moved past the breakeven rate of 63% (1-max Federal tax rate of 37%) and have posed the question: What will bring this relationship back in line?
The easy answer is higher tax rates. However, barring that, the factors contributing to a realignment are as follows.
- Higher municipal new issue supply causing municipal rates to increase relative to Treasury rates. The municipal market tends to outperform all other fixed income markets during two periods of the year, January – March and July – September. The reason is quite simple:
The municipal market's most significant maturity and coupon payment dates are 1/1 and 7/1. This increase in organic demand for municipal bonds is met with a decreased level of supply brought about by lower staff levels during the holiday seasons. Demand exceeds supply, economics 101. - If the inequality continues for some time, there will be a disintermediation from municipal securities to other fixed income securities as investors realize that their interests are better served in other fixed income sectors. This may take some time as things like unrealized capital gains are factored in.
Investors follow up this question by asking where this realignment will come from—the Treasury side of the equation or the municipal side. By our way of thinking, it doesn’t matter; we all live in a relative world and make relative total return decisions.
One other thing of note. AAA general obligation municipal bonds should trade at a premium to Treasury securities, especially for maturities longer than ten years. The reasons are as follows:
- Relative credit quality. Both can tax their populations, but the Federal government has much broader taxing power than an AAA state.
- Most municipal bonds with maturities longer than ten years have a ten-year call attached to them.
We believe that the relative value relationship between Treasury securities and municipal securities, all else equal, will revert to a more normal distribution in the next few months as the supply of new issue municipal bonds increases and the market approaches April 15. Tax season is a theme for another piece.
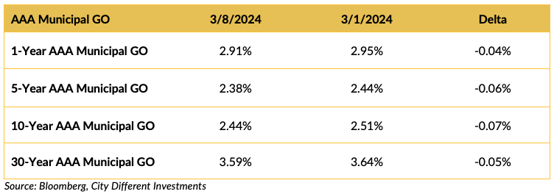
The municipal market moved lower across the entire curve.
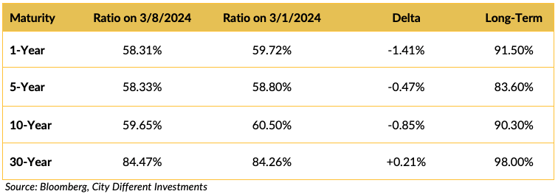
The municipal/Treasury ratio proceeded to get more expensive in the 1-10 year part of the curve. Ratios are rich relative to Treasury but also to US corporates.
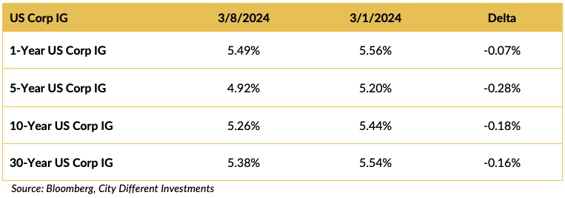
Rates in the corporate market segment came down in a significant way.
THIS WEEK IN WASHINGTON
.png?width=1920&name=graphs%20in%20order%20(1).png)
President Biden came off assertive in his State of the Union address. Some view the State of the Union as the start of his campaign for the November elections. The audience was heavily politicized, with attendees draped in Ukraine colors and Trump merchandise.
Biden’s framework for re-election was laid in raising taxes for the wealthy and expanding a cap on insulin prices and drug costs. President Biden will use the budget proposal for fiscal 2025 to double down on tax hikes for wealthy Americans and large corporations. There were also promises to re-enact Roe V. Wade and to expand background checks on gun purchases.
A House committee has put forth a bill that could be the start of a ban against TikTok. This ban prevents TikTok from being available on US app stores, which is currently being used by 170 million Americans. The irony here is that President Biden launched his re-election campaign on TikTok but has agreed to go ahead with the ban if the bill is presented to him.
On the geopolitical front, the President is warning Israel against the invasion of Rafah, which would be a “red line.” He was hoping to have a breakthrough in the conflict before the start of the holy month of Ramadan, which started Sunday.
WHAT, ME WORRY ABOUT INFLATION?
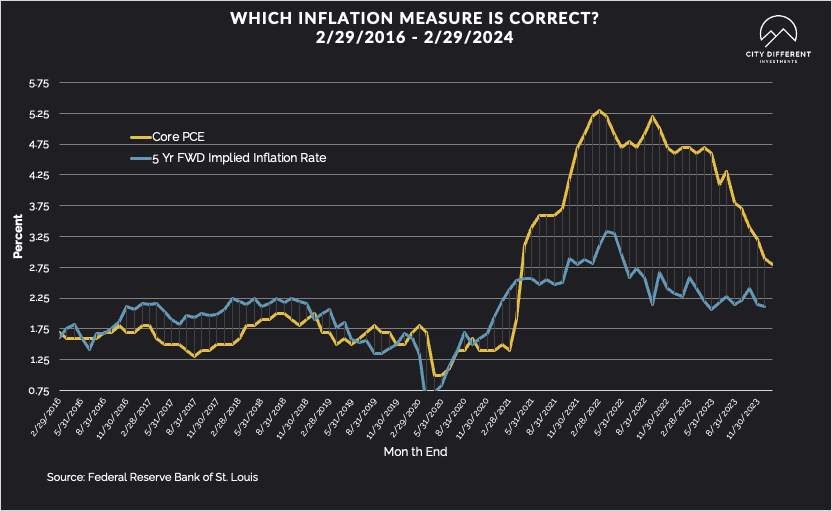
The 5-year Breakeven Inflation Rate finished the week of March 8 at 2.34%, six basis points lower than the March 1 close of 2.40%. The 10-year rate finished the week at 2.28%, four basis points lower than the close of March 1 at 2.32%.
MUNICIPAL CREDIT
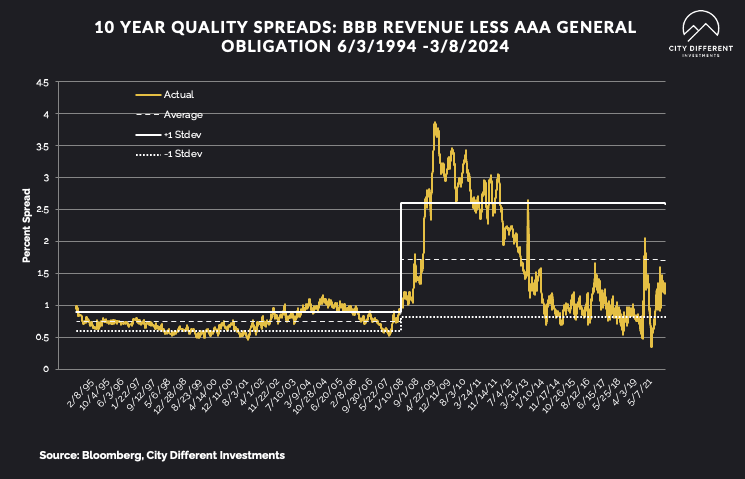
10-year quality spreads (AAA vs. BBB) as of March 8 were 1.19%, four basis points tighter than the March 1 reading of 1.23% (based on our calculations). The long-term average is 1.71%.
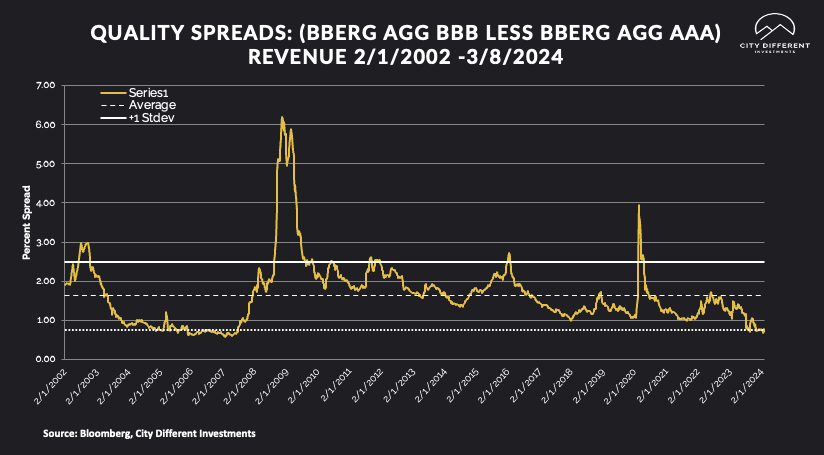
At 0.70%, quality spreads in the taxable market last week were seven basis points tighter than the week before. High-yield quality spreads on March 8 were at 2.93% versus 3.01% last week.
Much like the municipal market supply, the credit market supply is heavier in March compared to the first two months of the year. We have seen $389 billion in new supply YTD. This is 31% higher than the same period last year. However, last year the macro environment was a lot more uncertain. The higher issuance also shows the issuer mindset that is no longer expecting much lower yields or a recession.
WHERE ARE FIXED-INCOME INVESTORS PUTTING THEIR CASH?
Money Market Flows (millions of dollars)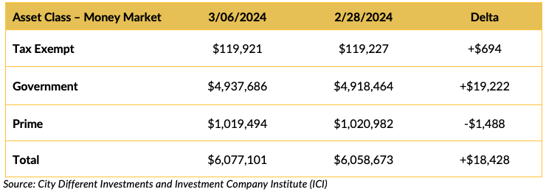
Money market funds saw positive flows in both tax exempt and government category while prime saw outflows.
Mutual Fund Flows (millions of dollars)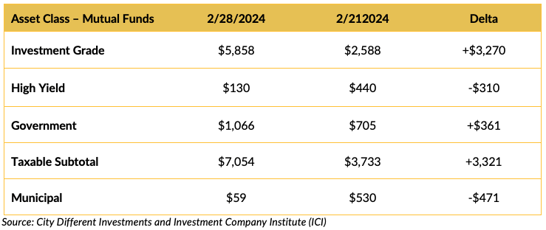
Bond funds saw a large inflow into the investment grade and total taxable market share, while Municipal and high-yield mutual funds saw a net drop in flows.
ETF Fund Flows (millions of dollars)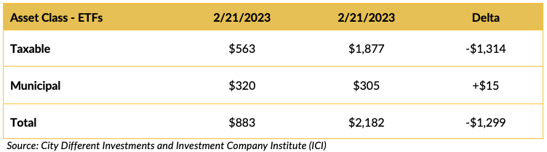
ETFs saw a drop in weekly issuance. However, municipals had a small uptick in issuance.
SUPPLY OF NEW ISSUE MUNICIPAL BONDS
This week boasts of an exciting tax-exempt calendar at close to $10 billion. We will be watching the market closely to see if spreads that are razor-tight give in as the market absorbs the supply.
CONCLUSION
The employment data last week was messy because of seasonal revisions. However, unemployment did tick up while wage inflation ticked down. We have attempted to answer the question of muni-treasury ratios being on the rich side of fair and whether we will see a revision to the long-term averages. President Biden has kicked off his campaign using the State of the Union address as a platform.
IMPORTANT DISCLOSURES
The information and statistics contained in this report have been obtained from sources we believe to be reliable but cannot be guaranteed. Any projections, market outlooks or estimates presented herein are forward-looking statements and are based upon certain assumptions. Other events that were not taken into account may occur and may significantly affect the returns or performance of these investments. Any projections, outlooks or assumptions should not be construed to be indicative of the actual events which will occur. These projections, market outlooks or estimates are subject to change without notice.
Please remember that past performance may not be indicative of future results. Different types of investments involve varying degrees of risk, and there can be no assurance that the future performance of any specific investment, investment strategy, or product or any non-investment related content, made reference to directly or indirectly herein will be profitable, equal any corresponding indicated historical performance level(s), be suitable for your portfolio or individual situation, or prove successful. Due to various factors, including changing market conditions and/or applicable laws, the content may no longer be reflective of current opinions or positions.
All indexes are unmanaged, and you cannot invest directly in an index. Index returns do not include fees or expenses. Actual portfolio returns may vary due to the timing of portfolio inception and/or investor-imposed restrictions or guidelines. Actual investor portfolio returns would be reduced by any applicable investment advisory fees and other expenses incurred in the management of an advisory account.
You should not assume that any discussion or information contained herein serves as the receipt of, or as a substitute for, personalized investment advice from City Different Investments. To the extent that a reader has any questions regarding the applicability above to his/her individual situation or any specific issue discussed, he/she is encouraged to consult with the professional advisor of his/her choosing. City Different Investments is neither a law firm nor a certified public accounting firm and no portion of this content should be construed as legal or accounting advice.
A copy of City Different Investments' current written disclosure statement discussing our advisory services and fees is available for review upon request.
Unless otherwise noted, City Different Investments is the source of information presented herein.
A description of the indices mentioned herein are available upon request.