

WEEK ENDING 3/1/2024
• Core PCE meets expectations.• Fed Chair to testify before Congress this week.
• Why is the consumer still unhappy?
A CITY DIFFERENT TAKE
The important takeaway from last week is the PCE data. The January headline PCE aligned with consensus expectations at 2.4% YoY increase. Core PCE rose by 0.4%. Even though this was the biggest increase in twelve months, market participants took solace in the fact that it was lower than the 0.5% rise in January. This brings the YoY rate to 2.8%, the lowest since March 2021.
Remember, the trend we want to see is lower inflation, but this might not be a linear path. The way we see this interpreted by the Federal Reserve is that it reinforces their conviction to wait before cutting rates.
The market is putting the probability of a May rate cut at 20%. The odds of a June cut stand at 77%. Remember inflation is not the only determinant here. The economy is strong, and unemployment is low. January showed strong employment growth of 353,000 jobs.
The most important data release this week is Friday’s employment report. Consensus is around 200,000 new jobs added in February.
Last time, we heard Chair Powell was on CBS’s 60 Minutes. This week he heads to Capitol Hill to testify before Congress on Wednesday and Thursday for his semiannual testimony. This hearing could turn very partisan, what with this being an election year, putting immense pressure on Powell. Both parties are likely to press Powell on topics from interest rate cuts to loosening bank capital requirements.
The Fed has a proposal to ramp up capital requirements for big banks by almost 20%. Timing couldn’t be more fortuitous, as this comes almost a year after the Silicon Valley Bank failure.
Finally, the University of Michigan consumer sentiment index showed a large downward revision for the month of February. This now brings it in line with 2018 numbers. This is truly baffling if inflation is coming down, the economy is strengthening, and unemployment is low.
We think that clues lie in a National Bureau of Economic Research paper which concludes that we are in a very high “cost of money” era. This is the highest since the Volcker era. “Cost of money” has a very real impact on a consumer’s cost of living. An example of this is high monthly payments on houses, cars, and even groceries.
CHANGES IN RATES
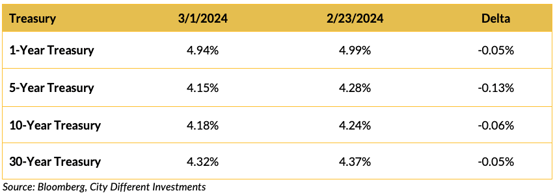
Treasury rates moved lower in the 1–5-year part of the curve and slightly lower in the long end.
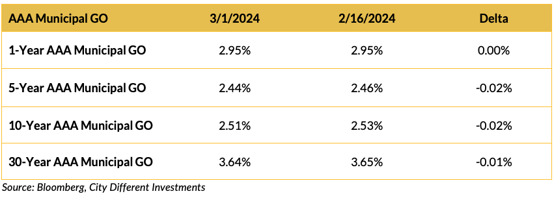
Municipal market remains shielded from the rate movements in the Treasury market. There was marginal rate movement in the municipal curve for lower rates.
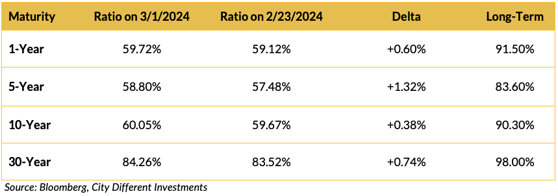
The municipal/Treasury ratio cheapened in the mid-to-long part of the curve because of Treasury rates going down.
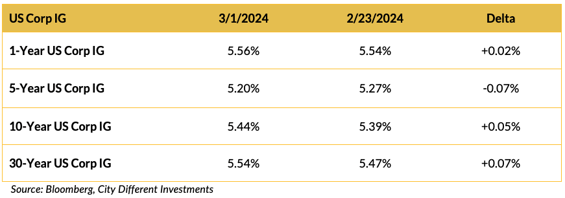
Rates in the corporate market segment were higher at the longer end of the curve and reversed the trends from last year.
THIS WEEK IN WASHINGTON
.png?width=1920&name=graphs%20in%20order%20(1).png)
Congress has come up with an agreement to keep the Federal government operating until September 30 of this year. Consider the can kicked. The $436 billion package covers about a quarter of government funding. The House will act first before President Biden’s State of the Union address on Thursday. The Senate may follow closely behind since many federal agencies will run out of money by the end of the week.
In other political news, Nikki Haley picked up her first primary victory and has signaled that she might not endorse former President Trump. This leads to strong speculation that she will run as a third-party candidate. The media is taking these cues from her statement to NBC that the “RNC is not the same RNC.”
Finally, the Supreme Court ruled unanimously on Monday that former President Trump can appear on the presidential ballot in Colorado. Next up for the SCOTUS, the justices will review former President Trump’s immunity claim, which is viewed as a victory as he tries to delay criminal prosecutions.
WHAT, ME WORRY ABOUT INFLATION?
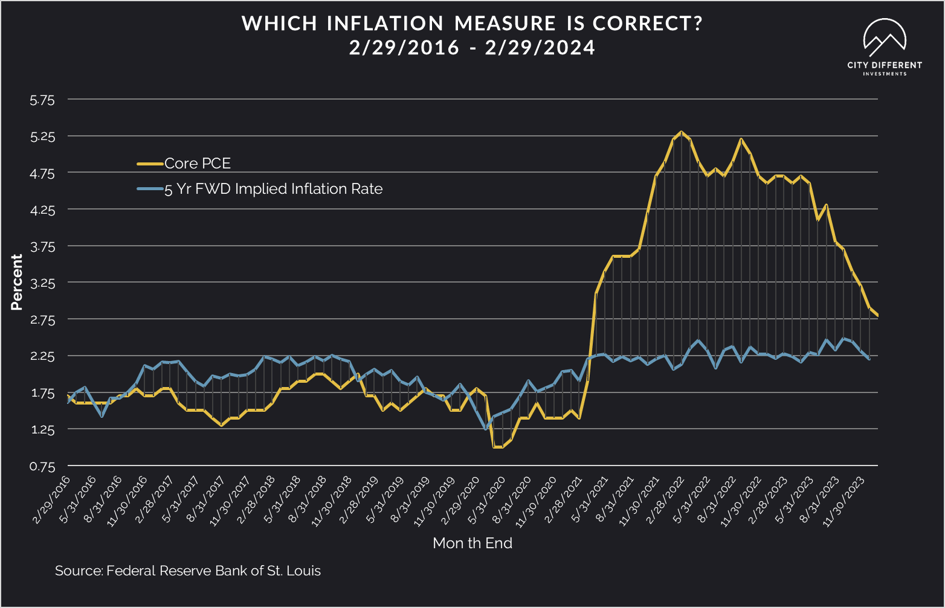
The 5-year Breakeven Inflation Rate finished the week of March 1 at 2.24%, two basis points lower than the February 23 close of 2.26%. The 10-year rate finished the week at 2.32%, two basis points higher than the close of February 23 at 2.30%.
MUNICIPAL CREDIT
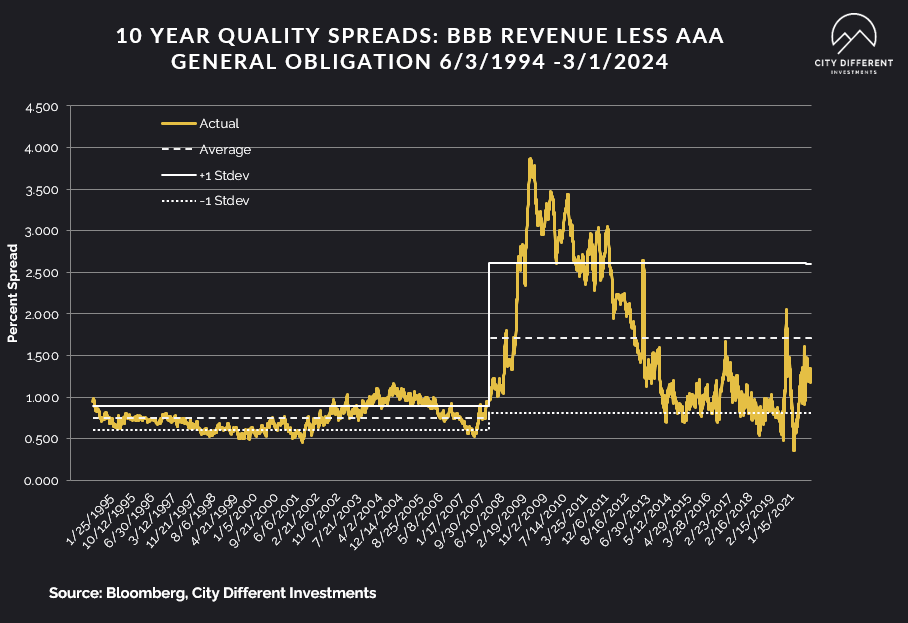
10-year quality spreads (AAA vs. BBB) as of March 1 were 1.23%, six basis points tighter than the February 23 reading of 1.29% (based on our calculations). The long-term average is 1.71%.
Municipal readings continue to be unchanged in yields with a decent issuance calendar and tight spreads and expensive ratios.
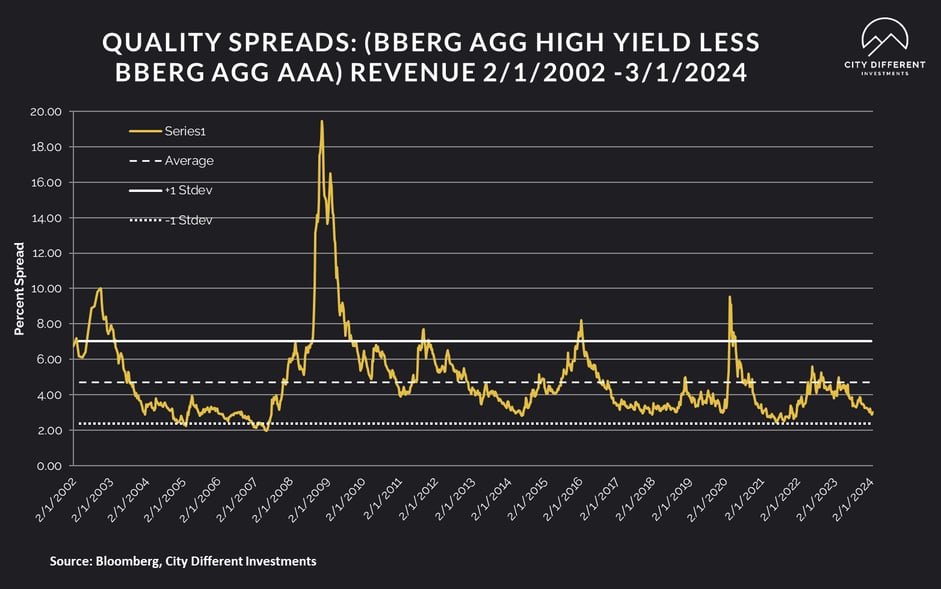
At 0.77%, quality spreads in the taxable market last week were nine basis points higher than the week before. High-yield quality spreads on March 1 were at 3.01% versus 2.87% last week.
Much like the municipal market supply, the credit market supply is heavier in March compared to the first two months of the year. We have seen $389 billion in new supply YTD. This is 31% higher than the same period last year. However, last year the macro environment was a lot more uncertain. The higher issuance also shows the issuer mindset that is no longer expecting much lower yields or a recession.
WHERE ARE FIXED-INCOME INVESTORS PUTTING THEIR CASH?
Money Market Flows (millions of dollars)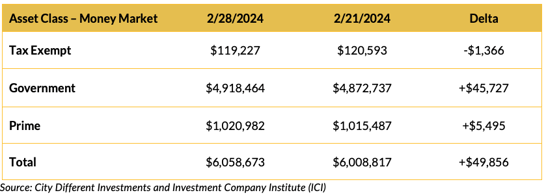
Money market funds saw lower flows in the tax-exempt category with significant fund flow into government and prime money categories resulting in a net positive for the whole class.
Mutual Fund Flows (millions of dollars)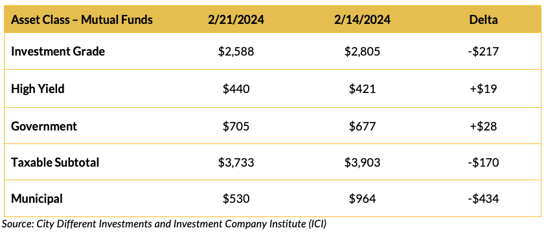
Bond funds saw lower inflows in both taxable and municipals.
ETF Fund Flows (millions of dollars)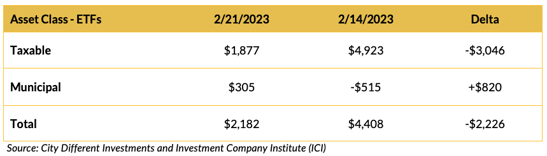
A drop in weekly net issuance in the ETF space for taxable bonds and an uptick into the positive category in the municipal space.
SUPPLY OF NEW ISSUE MUNICIPAL BONDS
Before we move on to this week’s supply, let’s recap the muni market’s supply for February. Issuance in February came in at $32 billion and YTD supply now is at $63 billion. The municipal calendar is poised for heavy supply which is in line with the March supply period. This week is expected to be around $6.9 billion.
CONCLUSION
The economy is firing on cylinders, inflation is trending correctly, and unemployment is low. So, why is the consumer miserable? NBER suggests it’s the high cost of capital, the highest since the Volcker era. The big news item from last week was a slightly higher core PCE which strengthens the Fed’s position of a wait-and-see approach. This week, all eyes are on two news items. The first is the Chair of the Federal Reserve testifying on Capitol Hill. The second is the employment figures to be released on Friday.
IMPORTANT DISCLOSURES
The information and statistics contained in this report have been obtained from sources we believe to be reliable but cannot be guaranteed. Any projections, market outlooks or estimates presented herein are forward-looking statements and are based upon certain assumptions. Other events that were not taken into account may occur and may significantly affect the returns or performance of these investments. Any projections, outlooks or assumptions should not be construed to be indicative of the actual events which will occur. These projections, market outlooks or estimates are subject to change without notice.
Please remember that past performance may not be indicative of future results. Different types of investments involve varying degrees of risk, and there can be no assurance that the future performance of any specific investment, investment strategy, or product or any non-investment related content, made reference to directly or indirectly herein will be profitable, equal any corresponding indicated historical performance level(s), be suitable for your portfolio or individual situation, or prove successful. Due to various factors, including changing market conditions and/or applicable laws, the content may no longer be reflective of current opinions or positions.
All indexes are unmanaged, and you cannot invest directly in an index. Index returns do not include fees or expenses. Actual portfolio returns may vary due to the timing of portfolio inception and/or investor-imposed restrictions or guidelines. Actual investor portfolio returns would be reduced by any applicable investment advisory fees and other expenses incurred in the management of an advisory account.
You should not assume that any discussion or information contained herein serves as the receipt of, or as a substitute for, personalized investment advice from City Different Investments. To the extent that a reader has any questions regarding the applicability above to his/her individual situation or any specific issue discussed, he/she is encouraged to consult with the professional advisor of his/her choosing. City Different Investments is neither a law firm nor a certified public accounting firm and no portion of this content should be construed as legal or accounting advice.
A copy of City Different Investments' current written disclosure statement discussing our advisory services and fees is available for review upon request.
Unless otherwise noted, City Different Investments is the source of information presented herein.
A description of the indices mentioned herein are available upon request.