.png)

WEEK ENDING 7/28/2023
Highlights of the week:
- Fed hikes rates another 25 basis points putting policy range at 5.25% – 5.50%.
- Powell still focused on inflation that remains higher than 2% goal.
- Treasury bonds see $102 billion record issuance.
A CITY DIFFERENT TAKE
The Federal Reserve raised rates another 25 basis points on Wednesday to put their target range between 5.25% and 5.50%. This is the highest policy rate in 22 years.
June was a harbinger of low inflation prints. June’s PCE and CPI reports came in at 3.8% and 3%, respectively. However, Core PCE (the Fed’s favorite measure of inflation and therefore our favorite measure) is up 4.1% year over year. In addition, after a surge of energy prices in June, we should see a rise in inflation reflecting those prices.
At the Fed’s Wednesday meeting, there was an acknowledgment by Powell of the Core PCE at 4.6% and lower CPI. However, the loud and clear message is that the mandate of getting inflation down to 2% has not been reached. In his remarks, Chairman Powell emphasized that inflation remains “well above our longer-term goal of 2%.”
We think that it is worth noticing that the Fed continues to stick to its 2% number. The Federal Reserve is giving itself more flexibility for additional rate increases and holding higher for longer so that inflation can cool down to the 2% target.
This week witnesses a bumper Treasury supply with $102 billion slated for bond sales. The reason for this big calendar is twofold: rising interest rates and the rising budget deficit. This is against the backdrop of the Fed shrinking its balance sheet. It is no surprise that rising rates have caused U.S. debt service costs to soar. The U.S. deficit finally hit $1.39 trillion for this fiscal year, a 170% increase for the same period year over year.
CHANGES IN RATES
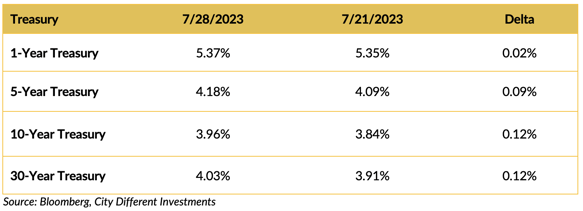
Treasury rates moved higher last week across the board. Long rates increased more than short rates. The curve steepened by 0.10% as measured from 1 to 30 years. The Fed raised short-term rates by 0.25%.
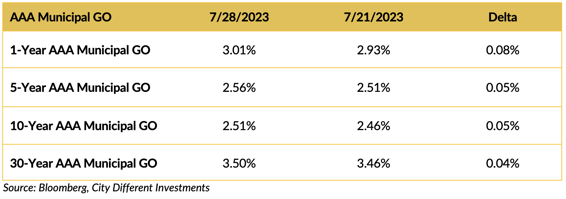
Municipal yields also moved higher last week but at a slower rate than the Treasury market.
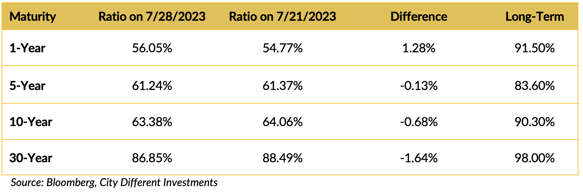
Longer-term muni/Treasury ratios are lower. One-year ratios cheapened up a little last week from more expensive levels.
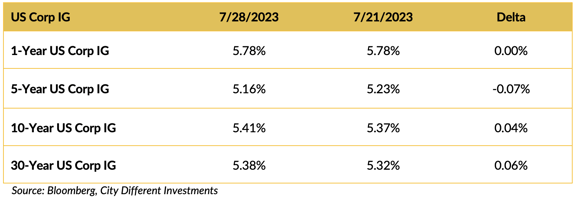
Yields in the investment grade (IG) corporate market were mixed last week.
THIS WEEK IN WASHINGTON
.png?width=1920&name=graphs%20in%20order%20(1).png)
GDP grew by 2.4%, which should certainly help President Biden’s bid for re-election. U.S. consumers and job markets have remained resilient. Consumer spending increased at 1.6%. The U.S. economy is in far better shape than economists and market participants anticipated coming into this year.
Even better news for Biden — the Federal Reserve stopped forecasting a recession, even with a restrictive monetary policy.
On the Republican front, former President Donald Trump is currently dominating his rivals in the polls and is still the front-runner.
WHAT, ME WORRY ABOUT INFLATION?
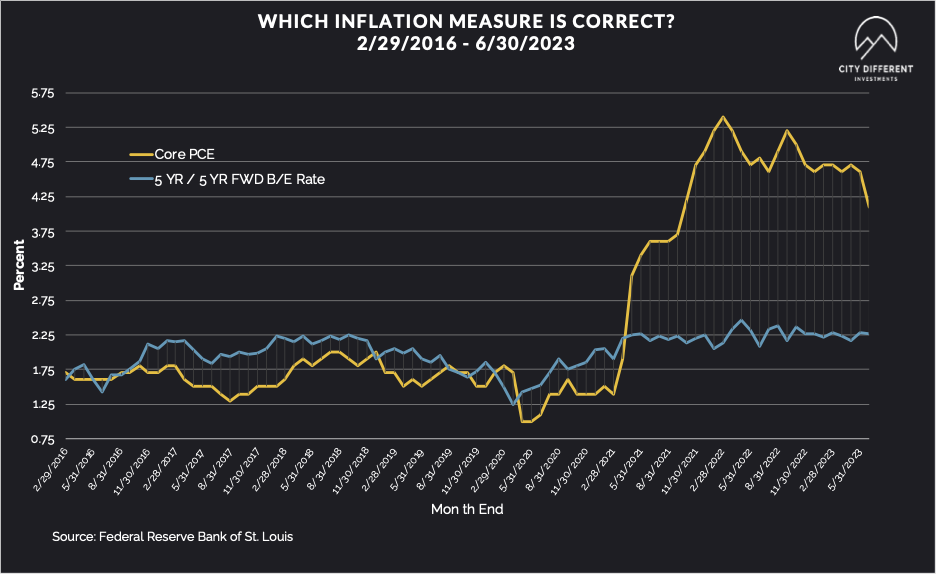
The 5-year Breakeven Inflation Rate finished the week at 2.48%, a 1-basis-point increase over the July 21 close of 2.47%. The 10-year Breakeven Inflation Rate finished the week at 2.38%, a 3-basis-point increase over the July 21 close of 2.35%.
MUNICIPAL CREDIT
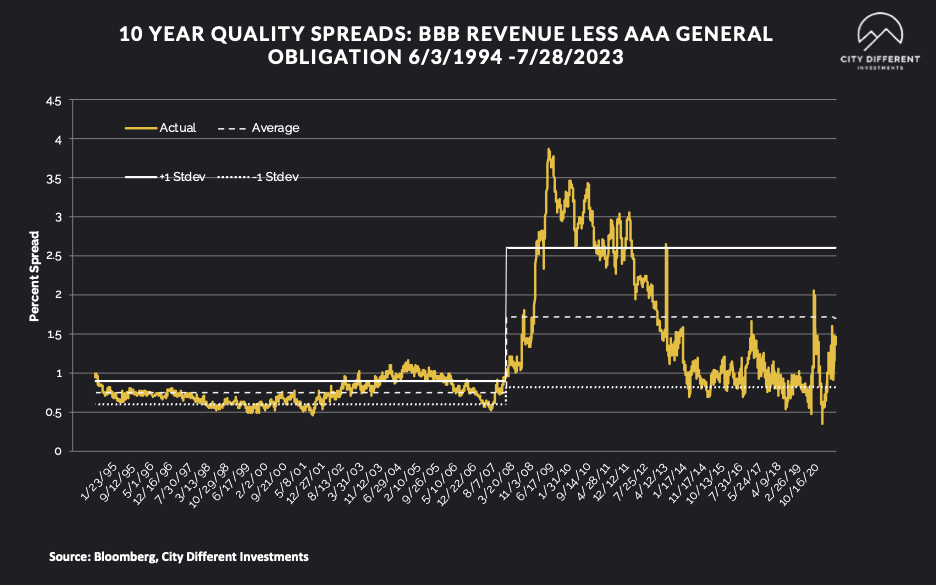
10-year quality spreads (AAA vs. BBB) as of July 28 was 1.41% (based on our calculations), 0.06% lower than the July 21 close of 1.47%. The long-term average is 1.71%. By our way of thinking, lower-quality securities are still not attractive but are moving in the right direction.
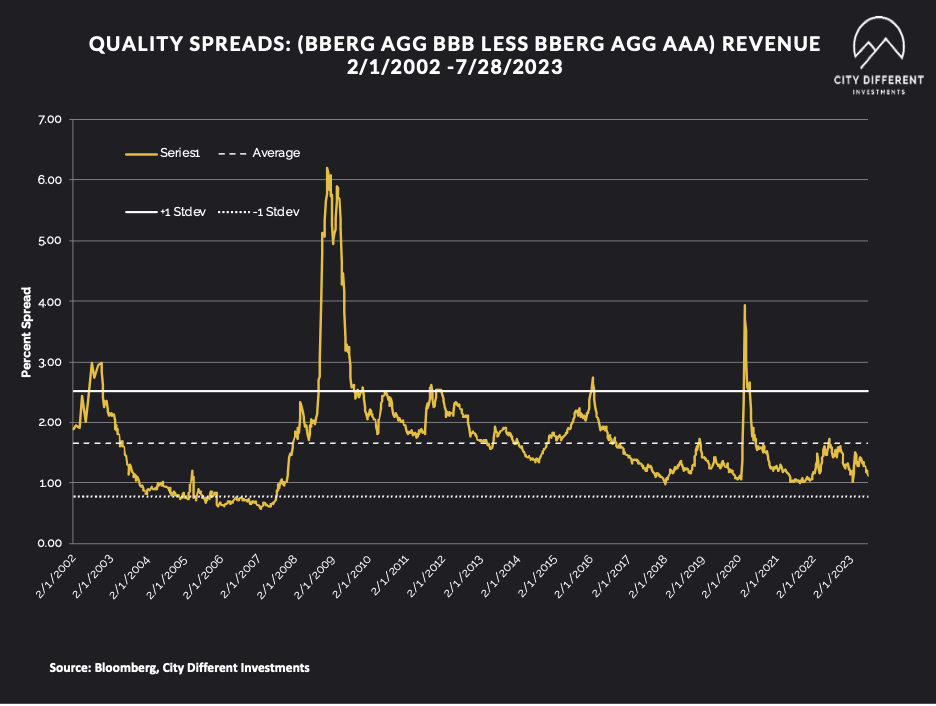
Quality spreads in the taxable market are not attractive but were stable last week, ending the week at 1.11%.
WHERE ARE FIXED-INCOME INVESTORS PUTTING THEIR CASH?
Money Market Flows (millions of dollars)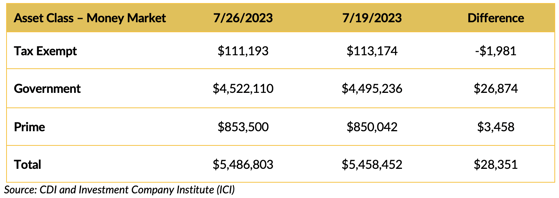
In total, money market funds saw positive cash flows. Municipal money market funds saw negative cash flows. That could be because of the richening of the municipal/taxable ratios.
Mutual Fund Flows (millions of dollars)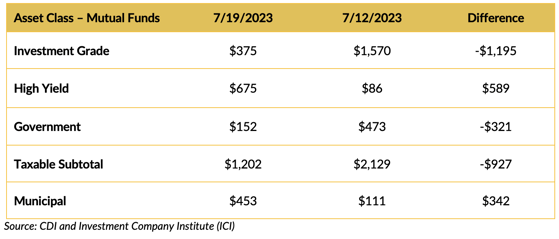
Flows into bond funds are negative for the week, except for the municipal market. Funny that the municipal market is rich compared to Treasuries and still sees positive cash flows. Retail investors chasing returns, perhaps?
ETF Fund Flows (millions of dollars)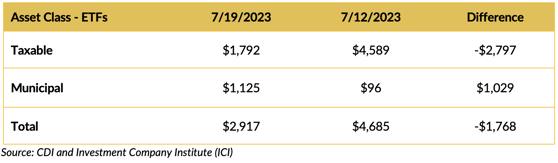
Bond ETFs also saw positive cash flows, albeit less than the week prior
SUPPLY OF NEW ISSUE MUNICIPAL BONDS
This week’s supply is starting to build, with reports slated somewhere around a moderate $10.9 billion.
CONCLUSION
Our biggest takeaway from last week is Chairman Powell's message that inflation is still too high. The Fed funds rate is already the highest it’s been in 22 years. But against the backdrop of strong June numbers and a growing GDP led by resilient consumers, the Fed has backed down from recession fears.
IMPORTANT DISCLOSURES
The information and statistics contained in this report have been obtained from sources we believe to be reliable but cannot be guaranteed. Any projections, market outlooks or estimates presented herein are forward-looking statements and are based upon certain assumptions. Other events that were not taken into account may occur and may significantly affect the returns or performance of these investments. Any projections, outlooks or assumptions should not be construed to be indicative of the actual events which will occur. These projections, market outlooks or estimates are subject to change without notice.
Please remember that past performance may not be indicative of future results. Different types of investments involve varying degrees of risk, and there can be no assurance that the future performance of any specific investment, investment strategy, or product or any non-investment related content, made reference to directly or indirectly herein will be profitable, equal any corresponding indicated historical performance level(s), be suitable for your portfolio or individual situation, or prove successful. Due to various factors, including changing market conditions and/or applicable laws, the content may no longer be reflective of current opinions or positions.
All indexes are unmanaged, and you cannot invest directly in an index. Index returns do not include fees or expenses. Actual portfolio returns may vary due to the timing of portfolio inception and/or investor-imposed restrictions or guidelines. Actual investor portfolio returns would be reduced by any applicable investment advisory fees and other expenses incurred in the management of an advisory account.
You should not assume that any discussion or information contained herein serves as the receipt of, or as a substitute for, personalized investment advice from City Different Investments. To the extent that a reader has any questions regarding the applicability above to his/her individual situation or any specific issue discussed, he/she is encouraged to consult with the professional advisor of his/her choosing. City Different Investments is neither a law firm nor a certified public accounting firm and no portion of this content should be construed as legal or accounting advice.
A copy of City Different Investments' current written disclosure statement discussing our advisory services and fees is available for review upon request.
Unless otherwise noted, City Different Investments is the source of information presented herein.
A description of the indices mentioned herein are available upon request.