.png)

WEEK ENDING 10/24/2025
- CPI data strengthens case for rate cut
- FOMC is likely to end its balance sheet runoff
- Deep dive: Bond market size comparison
A CITY DIFFERENT TAKE
Last Friday, CPI data was released. CPI rose by 0.3% in September and by 3% year over year. Even though inflation is higher than the Federal Reserve’s 2% mandate, the underlying trend in CPI shows a lower-than-expected monthly increase. This decreases the urgency surrounding inflation and supports the thesis for rate cutting and a dovish Fed.
The markets have priced in a 25-basis-point rate cut for next week’s meeting. However, there is dissent within the Fed. Most members support two rate cuts over the rest of 2025, but seven on the committee have indicated their support for no rate cuts for the remainder of the year.
The more interesting piece of Federal Reserve news, however, is the end of quantitative tightening (QT). A quick refresher: QT means the Fed shrinks its balance sheet by letting assets roll off and not reinvesting, or by selling assets — thereby reducing liquidity, lifting interest rates, and slowing the economy. The Fed began allowing its portfolio of Treasuries and mortgage-backed securities (MBS) to roll off in 2022 as part of normalization after the pandemic/response.
The pace of non-reinvestment roll-offs was adjusted several times. For example, by June 2024, the cap on Treasuries was about $25 billion a month, and MBS was about $35 billion a month. Then, from April 2025, the Treasuries cap was cut to $5 billion a month while the MBS cap remained around $35 billion a month. As of October 2025, the Fed is signaling that it is nearing the end of its QT program and may soon stop or significantly dial back further balance sheet reductions.
One of the concerns with the end of QT is the potential stress on money markets/short-term funding that we saw in 2019. This is when the Fed initiated temporary open market operations (TOMOs) to alleviate any funding pressures in the financial markets. The overnight and term open market operations following the “repocalypse” made the Fed the second largest participant in the repo market, normalizing repo rates, suggesting that the central bank would step in to help with any liquidity drainage.
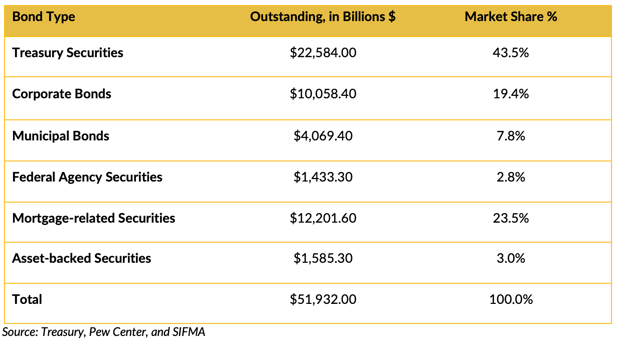
As students of the U.S. bond market, we compared the three segments we focus on: Treasury, investment-grade corporates, and the municipal market.
A market size comparison helps illustrate how Treasuries, corporates, and municipals contribute to the overall structure of the U.S. bond market — Treasury, around $28 trillion; corporate, around $10 trillion; and municipal, around $4 trillion. (Sources: Treasury, Pew Center, and SIFMA)
- The municipal market remains the smallest of the three major segments.
- For an investor or analyst comparing scale: the municipal market is roughly half to one-third the size of the corporate market and around one-seventh (or even smaller) of the Treasury market in current outstanding value.
- Growth has been strongest in Treasuries, moderate in corporates, and slow in municipals (at least in terms of outstanding size) over the last several years.
CHANGES IN RATES
Treasury Market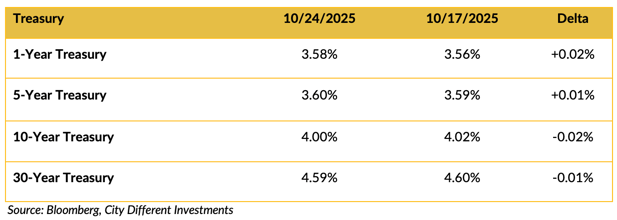
Treasury rates remained range-bound week over week. The 2/10 year slope ended the week at 52 basis points.
Municipal Market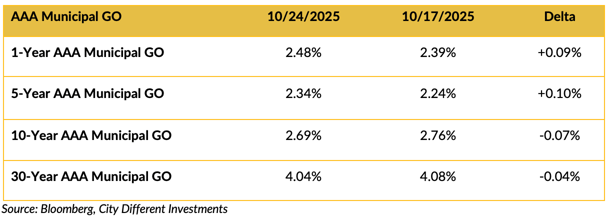
Yields in the municipal market were mixed last week. 1-year and 5-year yields rallied and the intermediate to the long-end price rallied. 2/10 spreads in the prior week increased by 26 basis points for the week ending Oct. 24.
An important note: the muni yield curve has flattened radically. For example, two months ago, the slope for AAA municipal market curve in the 2/10 stood at 99 basis points. In short, the value out on the curve has diminished in the last two months.
Selected Municipal AAA General Obligation Bond / Selected Treasury Bonds Yield Ratio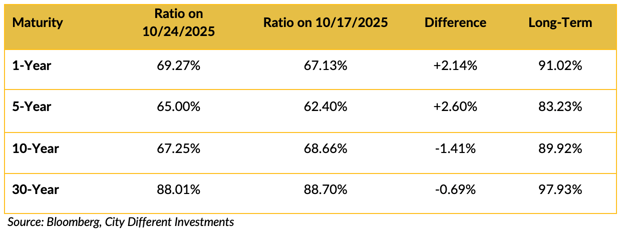
Treasury-muni ratios were cheaper for shorter maturities and richer for maturities 10 years and older. This trend has been strengthening throughout the month. The value argument rests in the front end of the muni curve right now.
Investment Grade Corporates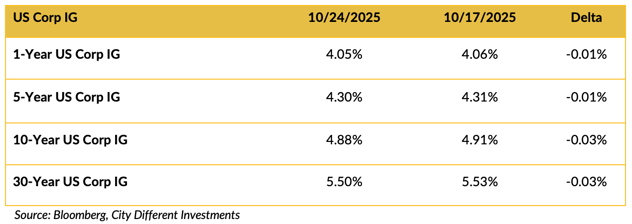
Investment grade corporate bond yields moved slightly lower week over week.
THIS WEEK IN WASHINGTON

Washington has been abuzz with news but no data. The government has been shut down since Oct. 1, the start of the fiscal year, because Congress failed to pass appropriations or a continuing resolution. It’s now one of the longest shutdowns in U.S. history. At 25 days as of this writing, it has already become the second-longest modern shutdown.
As a reader pointed out to us, investors should take comfort in the fact that government shutdowns have historically had a limited economic impact. Over the past three decades, the federal government has been closed for a total of eighty days, and none of those shutdowns occurred during a recession. In fact, the U.S. economy has tended to fare better during periods of shutdown than when the government is fully operational. First Trust Economics Blog - The Antidote to Conventional Wisdom.
The Senate failed to advance the House’s funding bill for the twelfth time. Democratic Senator Jeff Merkley spoke for more than 22 hours on the Senate floor, calling attention to what he characterized as constitutional overreach by the executive branch. Meanwhile, the House continues to be largely out of session, with Speaker Mike Johnson keeping a “48-hour notice” return schedule.
A federal judge temporarily halted the Trump administration’s plan to lay off more than 4,100 federal employees as part of the shutdown, siding with unions that argued the cuts would violate existing law (specifically, the Antideficiency Act).
WHAT, ME WORRY ABOUT INFLATION?
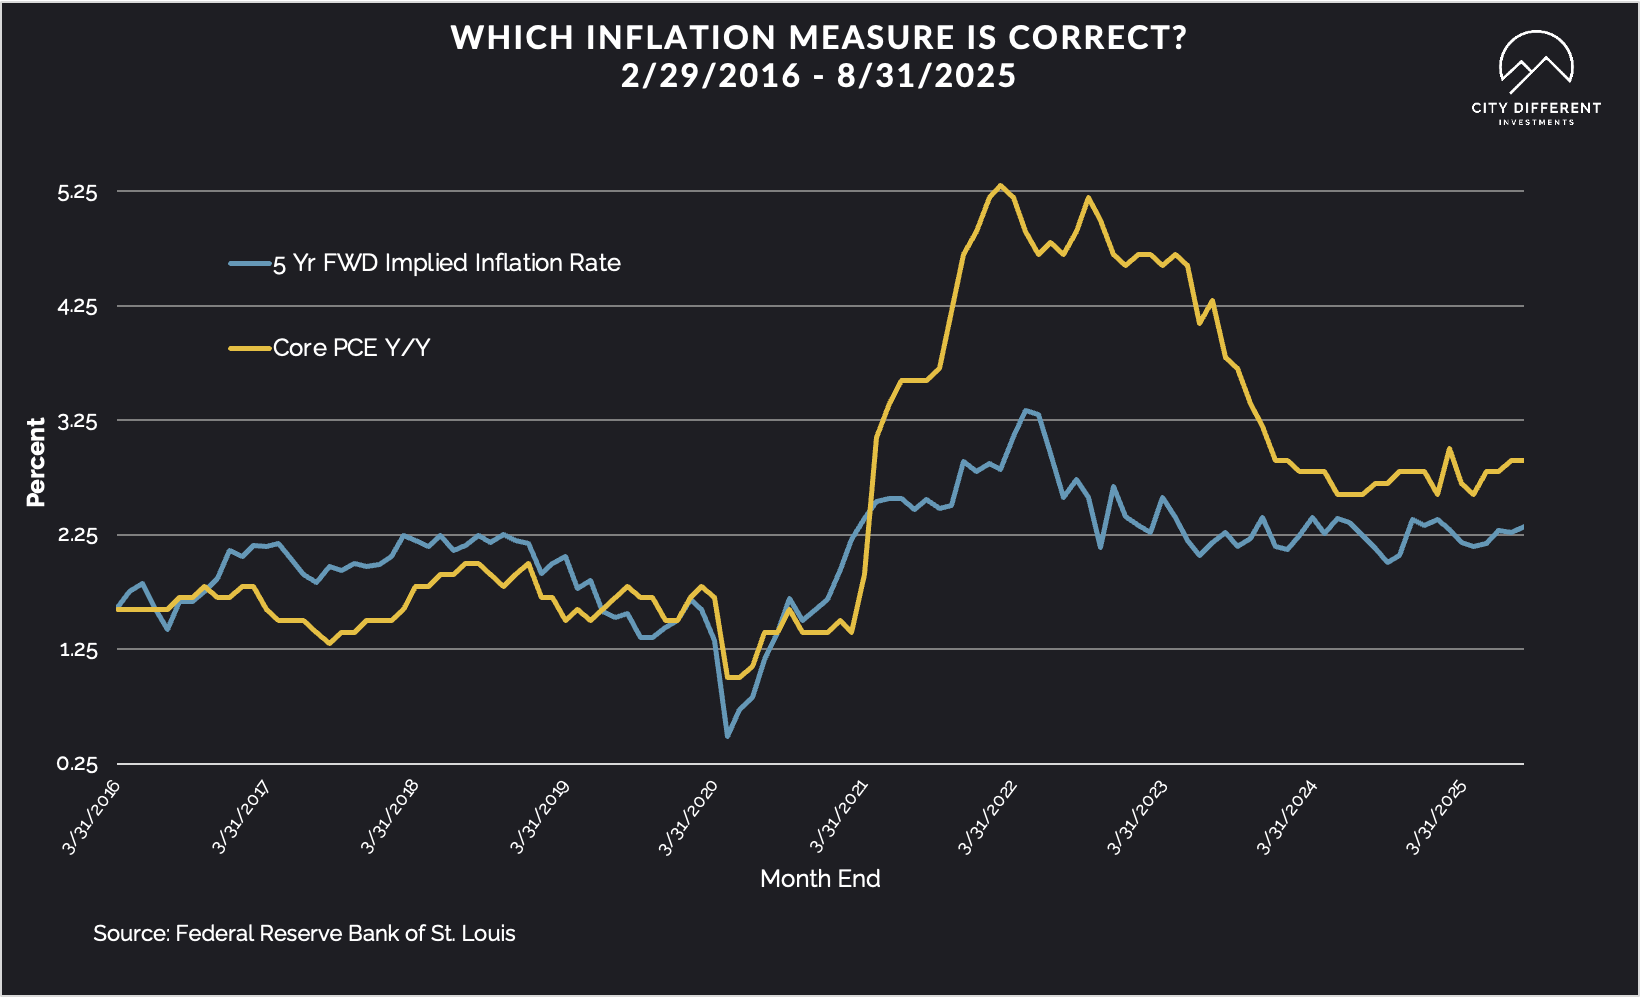
The 5-year Breakeven Inflation Rate finished the week of Oct. 24 at 2.18%, 7 basis points lower than the previous week. The 10-year Breakeven Inflation Rate finished the period at 2.29%, 1 basis point lower than last week's observation.
MUNICIPAL CREDIT
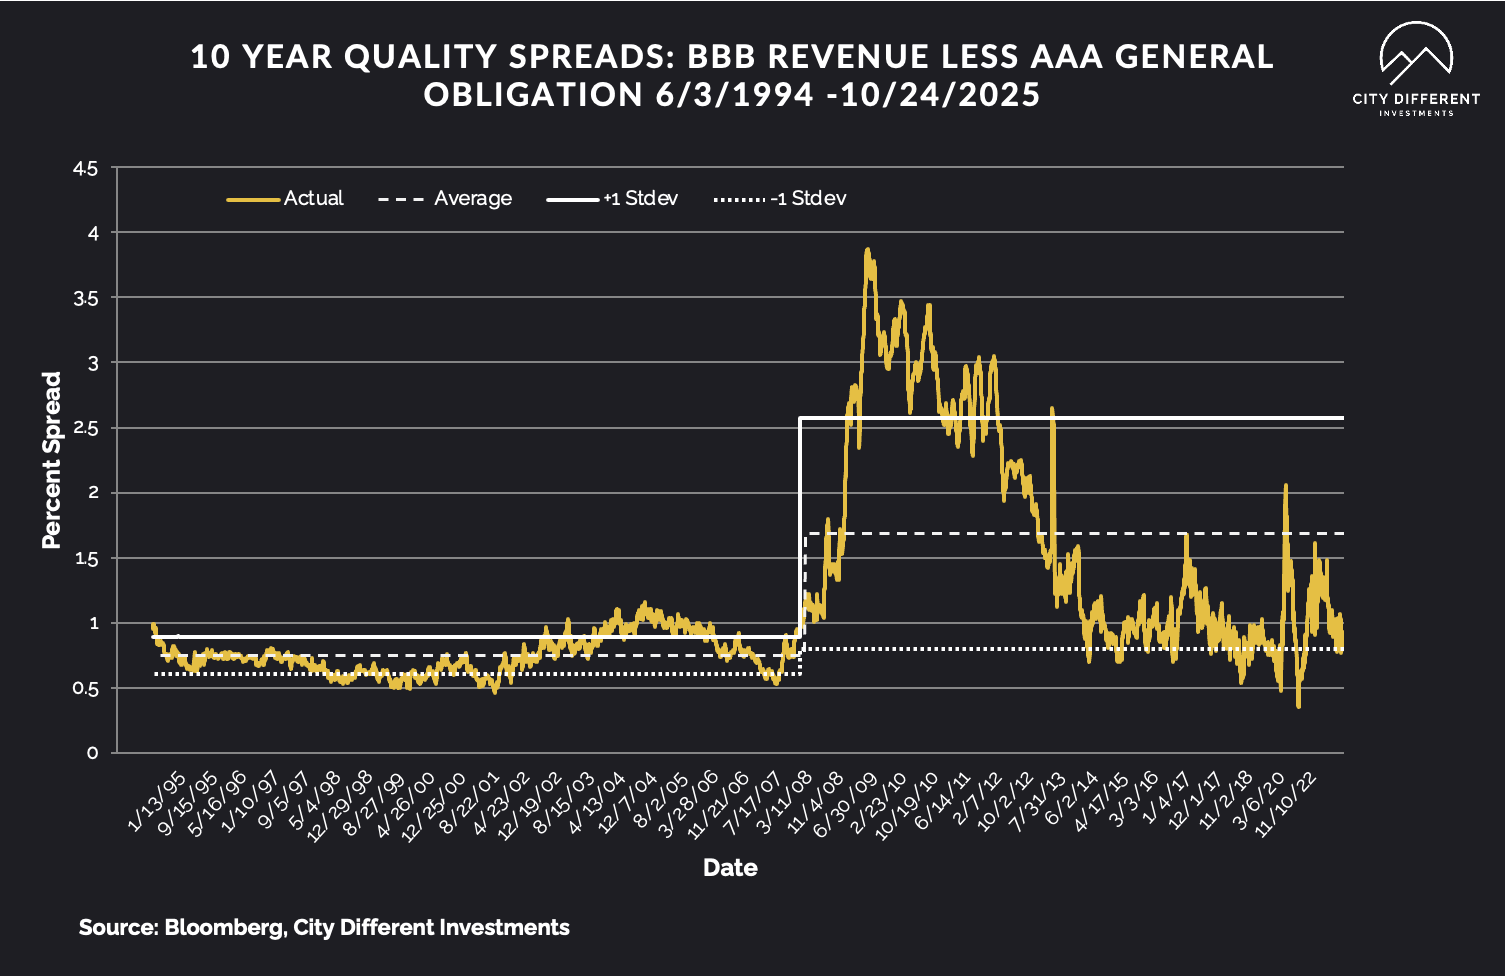
Last week's 10-year quality credit spread between BBB revenue and AAA general obligation bonds was at 0.92% versus a historical average of 1.68%, demonstrating very healthy and tight spread metrics.
TAXABLE CREDIT
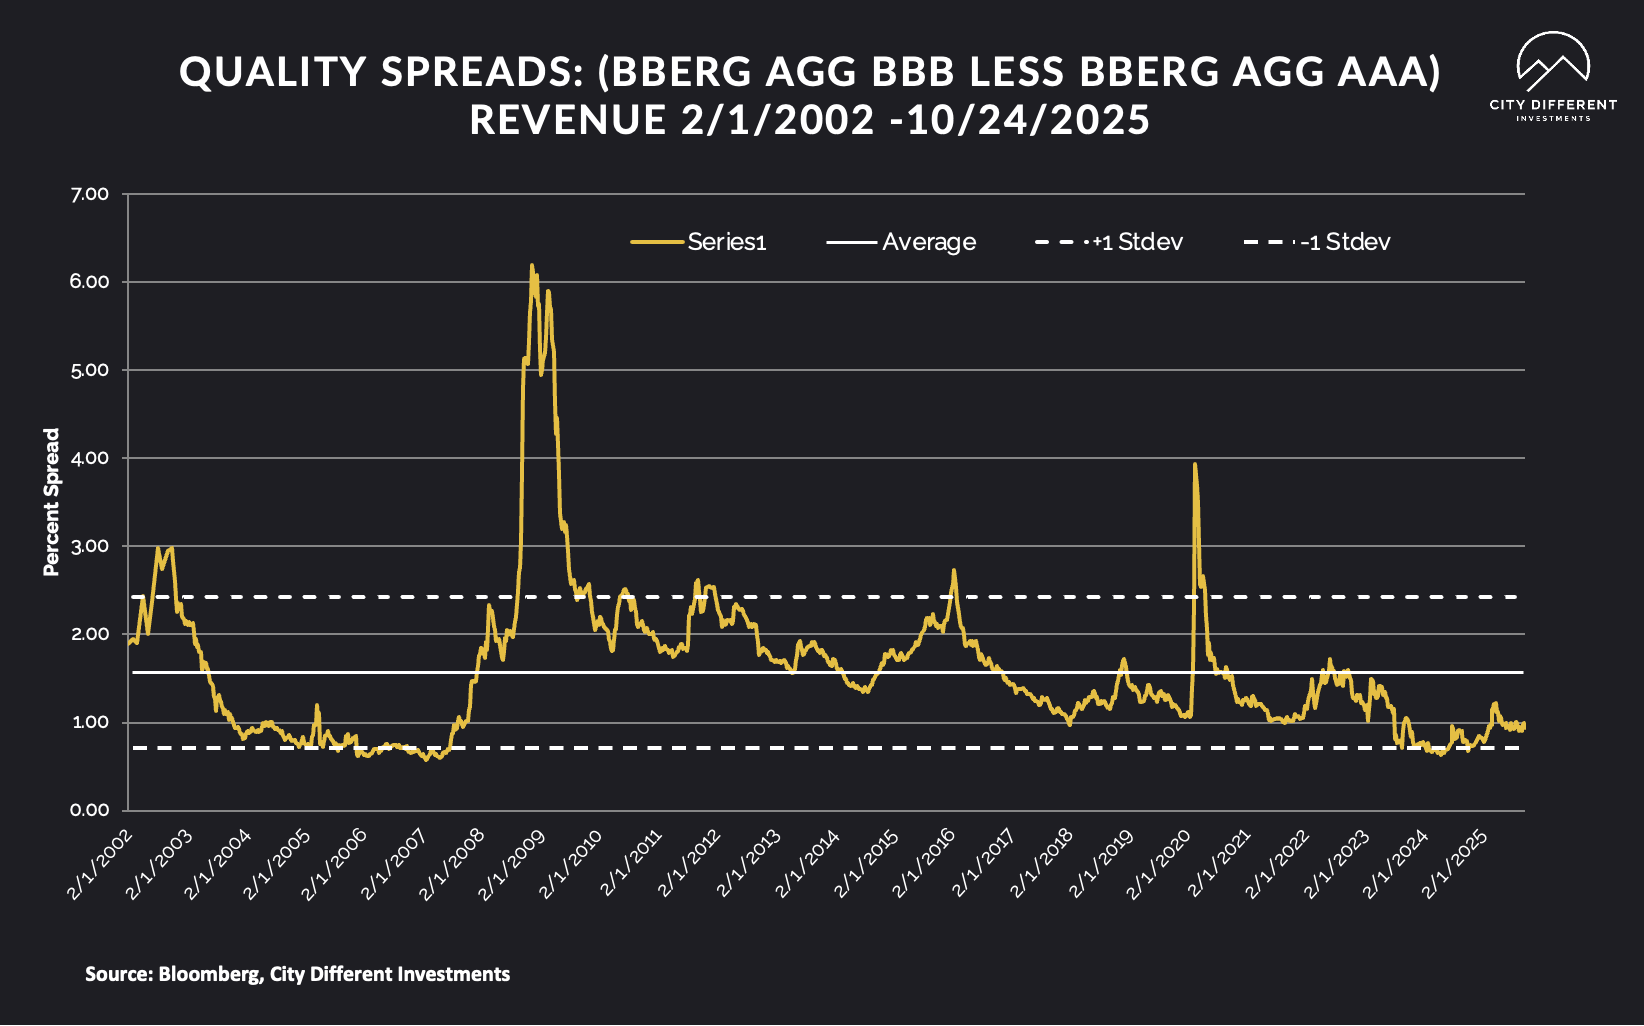
Investment grade spreads are tight at 0.94%, 6 basis points lower than last week. This is still very tight compared to a historical average of 1.57%. The high-yield spread is lower at 2.73%, compared to a historical average of 4.57%. We believe that both these markets are overpriced on a spread basis. The latest credit tumult has not been represented in the current credit spreads.
WHERE ARE FIXED-INCOME INVESTORS PUTTING THEIR CASH?
Money Market Flows (millions of dollars)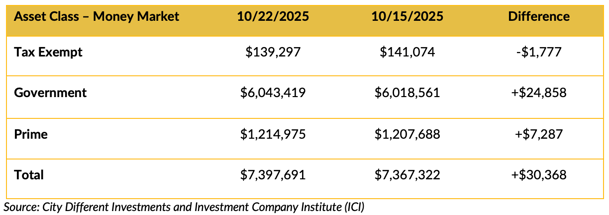
Money market fund flows were up in total last week, led by the government category.
Mutual Fund Flows (millions of dollars)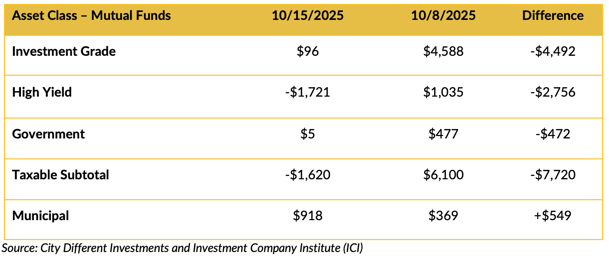
Mutual fund flows were mixed from the prior week.
ETF Fund Flows (millions of dollars)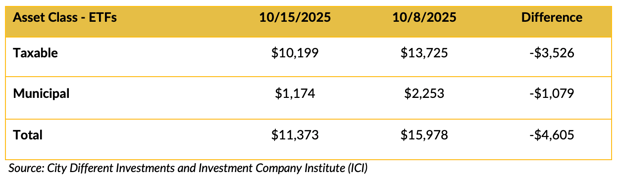
ETFs were positive over the week.
SUPPLY OF NEW ISSUE BONDS
Last week was a big supply week, with $14 billion issued. The markets absorbed the long end of these deals well. This week is anticipated to be a lower issuance week, with $5.6 billion.
CONCLUSION
CPI data proved to be much ado about nothing. Inflation remains elevated but at a sustained range-bound state. The market is feeling confident about a 25 basis point rate cut. Notably, the end of QT is anticipated for October, pending a signal from the Fed. The government stalemate continues. However, the market is not worried about Washington for now.
IMPORTANT DISCLOSURES
The information and statistics contained in this report have been obtained from sources we believe to be reliable but cannot be guaranteed. Any projections, market outlooks or estimates presented herein are forward-looking statements and are based upon certain assumptions. Other events that were not taken into account may occur and may significantly affect the returns or performance of these investments. Any projections, outlooks or assumptions should not be construed to be indicative of the actual events which will occur. These projections, market outlooks or estimates are subject to change without notice.
Please remember that past performance may not be indicative of future results. Different types of investments involve varying degrees of risk, and there can be no assurance that the future performance of any specific investment, investment strategy, or product or any non-investment related content, made reference to directly or indirectly herein will be profitable, equal any corresponding indicated historical performance level(s), be suitable for your portfolio or individual situation, or prove successful. Due to various factors, including changing market conditions and/or applicable laws, the content may no longer be reflective of current opinions or positions.
All indexes are unmanaged, and you cannot invest directly in an index. Index returns do not include fees or expenses. Actual portfolio returns may vary due to the timing of portfolio inception and/or investor-imposed restrictions or guidelines. Actual investor portfolio returns would be reduced by any applicable investment advisory fees and other expenses incurred in the management of an advisory account.
You should not assume that any discussion or information contained herein serves as the receipt of, or as a substitute for, personalized investment advice from City Different Investments. To the extent that a reader has any questions regarding the applicability above to his/her individual situation or any specific issue discussed, he/she is encouraged to consult with the professional advisor of his/her choosing. City Different Investments is neither a law firm nor a certified public accounting firm and no portion of this content should be construed as legal or accounting advice.
A copy of City Different Investments' current written disclosure statement discussing our advisory services and fees is available for review upon request.
Unless otherwise noted, City Different Investments is the source of information presented herein.
A description of the indices mentioned herein is available upon request.