.png)
.png?width=793&height=248&name=Copy%20of%20HEader%20for%20blog.%20T1%20(6).png)
In the 1980s, very few equity fund managers adhered to an indexing strategy. Fund managers were actively picking stocks to generate alpha for their clients. But over the course of the 1990s and 2000s, that all changed.
According to an influential paper published by the Yale School of Management in 2009, in the 1980s, the fraction of pure index funds was around 1%. By the end of the 1990s, that had soared to 15% of mutual fund assets. In 2023, passive assets eclipsed active assets for the first time. But beyond that, there has been a huge increase in shadow or “closet” indexers — funds that were “actively managed” in name, but deviated from their benchmark funds <60%. These closet indexers had more than 30% of all assets in 2009 (compared to almost zero in the 1980s).
It’s not hard to understand this shift — asset diversification mixed with much lower fees made passive investing attractive to a slew of investors. The rise of ETFs and online trading made investing in these benchmark funds easy, cheap, and accessible for basically anyone with a computer.
But there was just one problem… the less actively a fund is managed, the lower its average returns (at least according to the Yale paper).
Active Share
Historically, tracking error was the chief indicator of how “active” a fund manager was — the more tracking error your fund had vs. its index, the more active the fund manager had managed the assets. But the paper’s authors thought that an incomplete description of what was happening. Yes, tracking error is one measure of activity, but it’s not the only one.
The paper’s authors came up with the term Active Share to capture the other piece of the puzzle. They described it as the “fraction of the portfolio that is different from the benchmark index.”
By evaluating fund managers on both axes, you can paint a clearer picture of both how active those managers are, as well as how successful each distinct type of activity is for generating alpha.
Funds with the highest Active Share outperform their benchmarks both before and after expenses, while funds with the lowest Active Share underperform after expenses. In contrast, active management as measured by tracking error does not predict higher returns.
By their calculation, tracking error alone did not equate to greater alpha, but Active Share did.
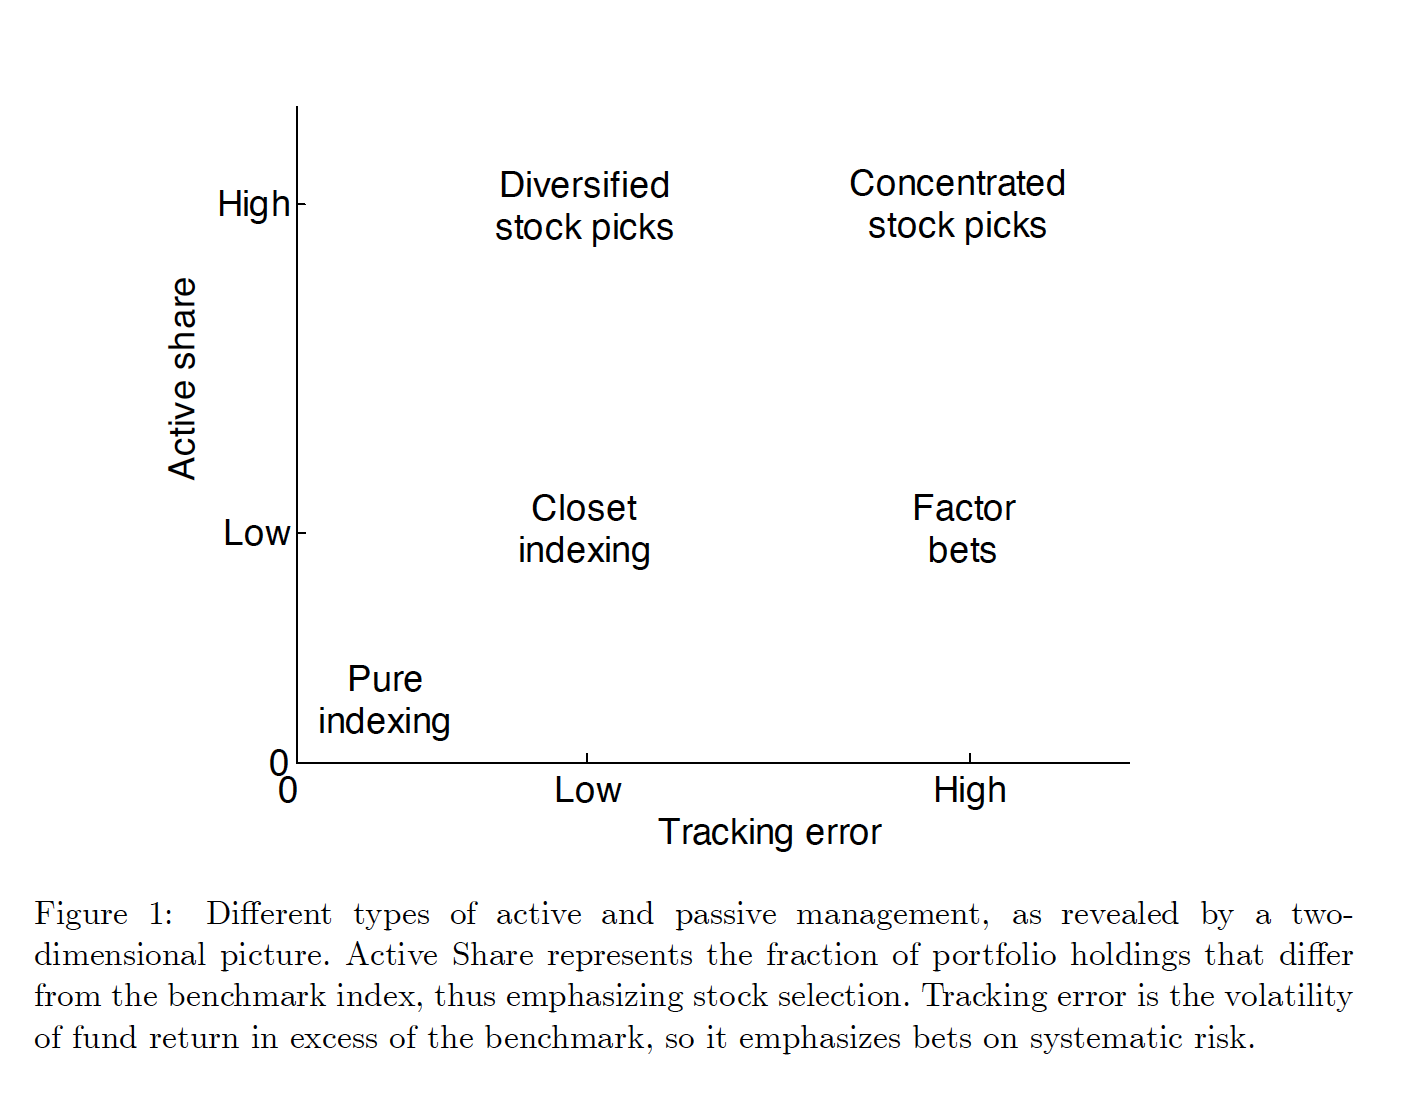
Using this two-axis approach, the paper divided fund managers into four groups: concentrated stock pickers, diversified stock pickers, closet indexers, and pure index funds. The paper describes them like this:
- Diversified stock pickers can be very active with low tracking error by making significant stock selections within industries.
- Concentrated stock pickers combine stock selection and systematic factor bets, resulting in high tracking error and high Active Share.
- Closet indexers score low on both dimensions while claiming to be active (and charging active management fees), leading to underperformance.
- Pure index funds have almost zero tracking error and Active Share, offering no alpha by design.
Obviously there’s little to no alpha with a pure index fund by definition. But when it comes to closet indexers, they perform the worst of all four (net of fees and transaction costs). These funds call themselves actively managed, but the variance between their holdings and concomitant tracking error renders them effectively passive in all but name. But, these funds charge active management fees, so investors aren’t benefiting from the low cost associated with pure index funds. When it comes to diversified and concentrated stock pickers, though, they tend to outperform their benchmarks:
The evidence… suggests that the funds with low Active Share and high tracking error tend to do worst, both in terms of net and gross returns, which implies that factor bets tend to destroy value for fund investors. Closet indexers (low Active Share, low tracking error) also exhibit no ability and tend to lose money after fees and transaction costs. The best performers are concentrated stock pickers (high Active Share, high tracking error), followed by diversified stock pickers (high Active Share, low tracking error). Both groups appear to have stock-picking ability, and even after fees and transaction costs the most active of them beat their benchmarks.
How well do these groups do you might ask? Well, the paper has an answer for you there:
Active Share does improve fund performance relative to the benchmark. The difference in benchmark-adjusted return between the highest and lowest Active Share quintiles is 2.55% per year (t = 3:47), which further increases to 2.98% (t = 4:51) with the four-factor model. The difference in abnormal returns is positive and economically significant within all tracking error quintiles. An investor should clearly avoid the lowest three Active Share quintiles and instead pick from the highest Active Share quintile. Funds in the highest Active Share quintile beat their benchmarks by 1.13% (t = 1:60), or 1.15% (t = 1:86) with the four-factor model.
The final factor I wanted to mention from the paper was time-adjusted returns over the prior year (essentially, did prior-year “winners” keep up their performance, or was it more of a “one-off” situation?). Their answer?
You guessed it — the more active, the better they did in the prior year:
The benchmark-adjusted net returns of the most active funds show remarkable persistence: the spread between the prior-year winners and losers is 6.81% per year (t = 3:35). In contrast, the least active funds have a spread of only 1.69% per year (t = 1:91).
There’s one important caveat to mention — it has been difficult for others to replicate this data in more recent studies. To us, however, there’s no question that closet indexing has been growing, and that it’s a recipe for underperformance. If you’re going to invest in active managers, you must invest in strategies with high active share to have the opportunity to outpace active fees.
So what does that mean for you?
The conclusion this paper reached was that the more active your fund manager truly is, the more likely they are to generate alpha. It’s not enough to just say “we’re an active fund manager” — tracking error + active share tells a much more complete story. Add to that fund size and prior year performance, and you can start to really separate the wheat from the chaff:
From an investor’s point of view, the prior one-year winners within the highest Active Share quintile seem very attractive, with a benchmark-adjusted 5.10% (t = 3:67) annual net return and a 3.50% (t = 3:29) annualized alpha with respect to the four-factor model. The performance of this subset of funds is also clearly statistically significant, supporting the existence of persistent managerial skill… This suggests that investors should pick active funds based on all three measures: Active Share, fund size, and prior one-year return.
If you’re attempting to beat the market (or a specific subset of the market), this paper argues you’re far more likely to achieve that by choosing a concentrated stock picker or diversified stock picker (they both exhibit high Active Share, but differ on their tracking error). But either way, the greater the active share, the more likely you as an investor (or a financial advisor) are to capture alpha.
Here at City Different Investments, we believe in active management. In equities, that means focused portfolios with high Active Share. But we think active management needs to be truly active — for us, that’s a low relative holdings count and high Active Share. If you’re going to pay for active management, make sure you’re not just buying indexes. As the bigs in our industry have gotten bigger, it has become harder and harder to avoid that trap!
IMPORTANT DISCLOSURES
The information and statistics contained in this communication have been obtained from sources we believe to be reliable but cannot be guaranteed. Opinions and statements of financial market trends that are based on market conditions constitute our judgment and are subject to change without notice. Any projections, market outlooks or forecasts discussed herein are forward-looking statements and are based upon certain assumptions. Other events that were not taken into account may occur and may significantly affect the returns or performance of these investments. Any projections, outlooks or assumptions should not be construed to be indicative of the actual events which will occur. Please remember that past performance may not be indicative of future results.
Different types of investments involve varying degrees of risk, and there can be no assurance that the future performance of any specific investment, investment strategy, or product, or any non-investment related content, made reference to directly or indirectly in this communication will be profitable, equal any corresponding indicated historical performance level(s), be suitable for your portfolio or individual situation or prove successful. Due to various factors, including changing market conditions and/or applicable laws, the content may no longer be reflective of current opinions or positions. No discussion or information contained herein serves as the provision of, or as a substitute for, personalized investment advice. To the extent that a reader has any questions regarding the applicability above to his/her individual situation of any specific issue discussed, he/she is encouraged to consult with the professional advisor of his/her choosing. City Different Investments is neither a law firm nor a certified public accounting firm and no portion of this content should be construed as legal, tax, or accounting advice.