

WEEK ENDING 5/29/2026
- Many inflation indicators (for now)
- A divided Federal Reserve
- Strong growth for first half
A CITY DIFFERENT TAKE
Core PCE came in at 0.24% month-over-month in April, a touch below the 0.3% consensus. This brings the year-over-year rate to 3.3%. On the surface, that is a benign number, and it will not materially change the Fed's calculus. But the divergence between inflation measures is what’s worth watching.
Historically, the market has cared about PCE and CPI as inflation indicators. However, the new Fed chair has explicitly flagged the Dallas Fed’s trimmed mean in his Senate testimony as a preferred inflation indicator. Dallas trimmed mean PCE fell to 2.35% year-over-year in April. At the same time, the New York Fed's multivariate core trend inflation metric has moved sharply higher, running at a 4.0% annualized monthly rate in April (up from roughly 3.0% at the start of the year). That divergence is a signal extraction problem the Fed will be navigating for months. The trimmed mean tells one story, the trend inflation metric tells another, and the war's energy shock is making it harder to separate noise from signal. The market needs Chair Warsh to publicly validate the trimmed mean measure.
The market has pulled back from peak hawkishness. Fed funds futures now imply roughly 13 basis points of tightening by year-end, a notable cooling from last Friday when 25 basis points were fully priced. The next FOMC meeting is June 16–17 and we are already seeing a divided “Fedspeak.”
Governor Waller said he can no longer rule out rate hikes further down the road if inflation stays elevated. Governors Schmid and Kashkari were more explicit, putting hikes on the table while acknowledging it is too early to commit to an imminent move. Governor Bowman was the notable exception, reiterating her support for easing bias and arguing that the war's inflationary impulse will prove short-lived. Philadelphia Fed President Paulson echoed that view, calling the current inflationary pressures temporary rather than structural.
Tariffs feel like a distant memory. However, on the fiscal side, IEEPA tariff refunds are moving fast. Customs and Border Protection, the U.S. federal agency that collects tariffs at ports of entry, has accepted $85 billion in potential and certified refund claims and has already paid out $21 billion. The refund pace has direct fiscal implications. The faster CBP pays out, the larger the FY2026 deficit will be, which is why the forecast was revised up by $40 billion for this fiscal year, with a corresponding $40 billion reduction in FY2027. It also feeds into the broader fiscal credibility narrative that Moody's flagged, which is keeping the term premium elevated on the long end. Last May, Moody's downgraded the U.S. credit rating on its fiscal trajectory.
Currently, the combination of an Iran energy conflict, IEEPA tariff refunds running faster than expected, and One Big Beautiful Bill is all contributing to deteriorating fiscal conditions.
The Bureau of Economic Analysis released a second estimate last week with real GDP at an annual rate of 1.6% in Q1 2026. The contributors to Q1 growth were exports, investment, and consumer spending. For now, Q2 GDP growth is being predicted at an annual rate of 2.6%. The Iran war and the reopening of the Strait of Hormuz are catalysts for the second half.
CHANGES IN RATES
TreasuryMarket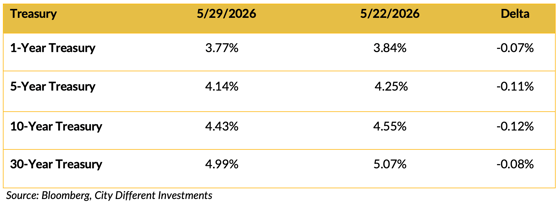
Treasury yields moved lower last week. 2/10 spread flattened to 43 basis points. The themes that drove Treasury yield lower last week were reports that the U.S. and Iran peace talks were closer to a deal.
Municipal Market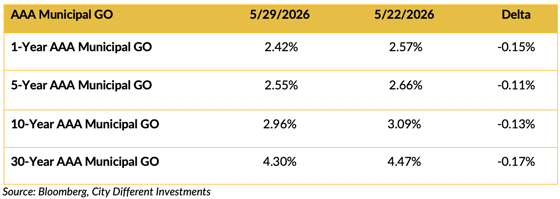
AAA general obligation municipal bond yields were also lower over the week. The 2/10 spread was marginally higher at 0.54%.
Selected Municipal AAA General Obligation Bond / Selected Treasury Bonds Yield Ratio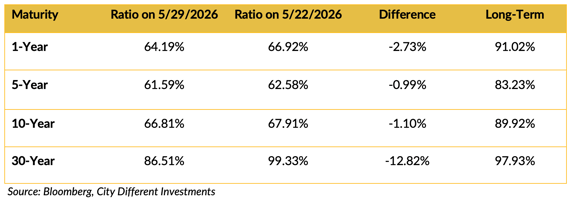
The muni/Treasury ratios got richer last week. Note the 30-year ratio that has jumped significantly week over week.
Investment Grade Corporates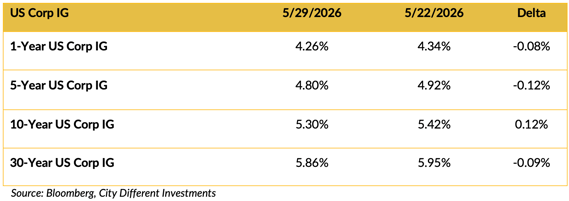
Investment grade corporate yield adjustments were more in line with the Treasury market yield adjustment. Corporate quality spreads did not move. The 2/10 spread is 89 basis points.
THIS WEEK IN WASHINGTON
Kevin Warsh was sworn in as the 11th Federal Reserve chair in a White House East Room ceremony on May 22, administered by Supreme Court Justice Clarence Thomas. His confirmation passed the Senate 54– 45, largely along party lines, with Pennsylvania Democrat John Fetterman providing the lone crossover vote.
Warsh arrives at a genuinely difficult moment for monetary policy. Headline inflation is running near its highest level in years, the war is injecting a supply-side energy shock that complicates the inflation signal, and the new chair inherits an institution still absorbing the political strain of the Powell years.
The Iran conflict entered its 13th week in what has become a defining pattern: diplomatic signals that advance just enough to move oil markets, followed by military actions and contradictory statements that remind everyone the war is not over.
WHAT, ME WORRY ABOUT INFLATION?

The 5-year Breakeven Inflation Rate finished the week of May 29 at 2.24%. The graph above contrasts a 5-year Breakeven Inflation Rate (this is the market-implied inflation rate) tracked weekly versus the core PCE inflation rate. The 10-year Breakeven Inflation Rate finished the period at 2.38%.
MUNICIPAL CREDIT
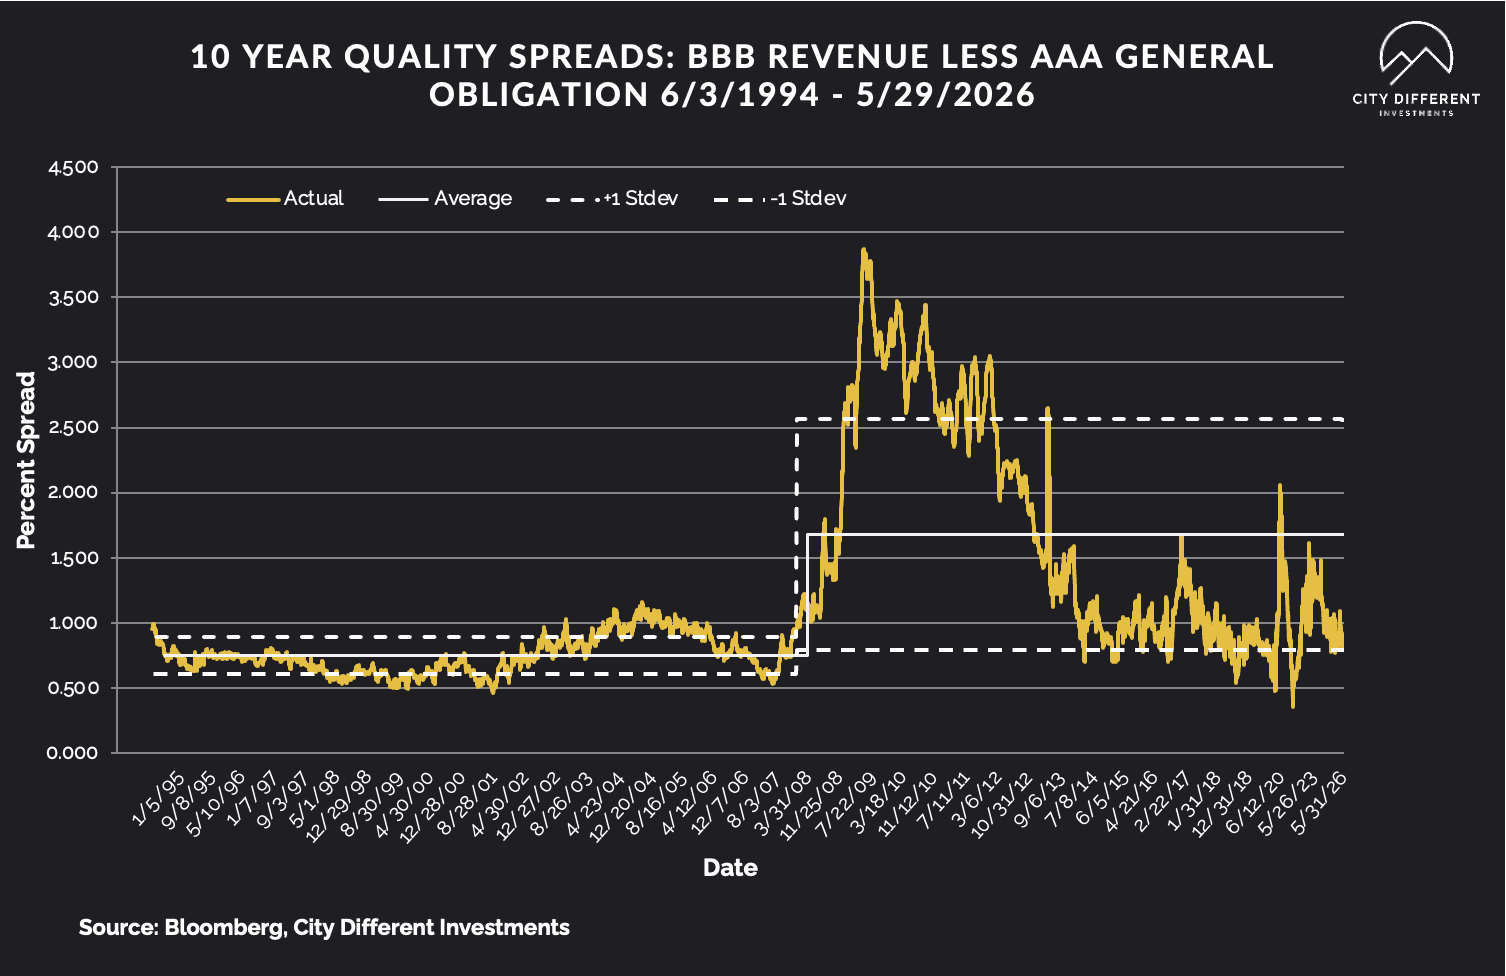
Last week's 10-year quality credit spread between BBB revenue bonds and AAA general obligation bonds was 0.85%, virtually unchanged week over week. The historical average credit spread is 1.67%.
TAXABLE CREDIT
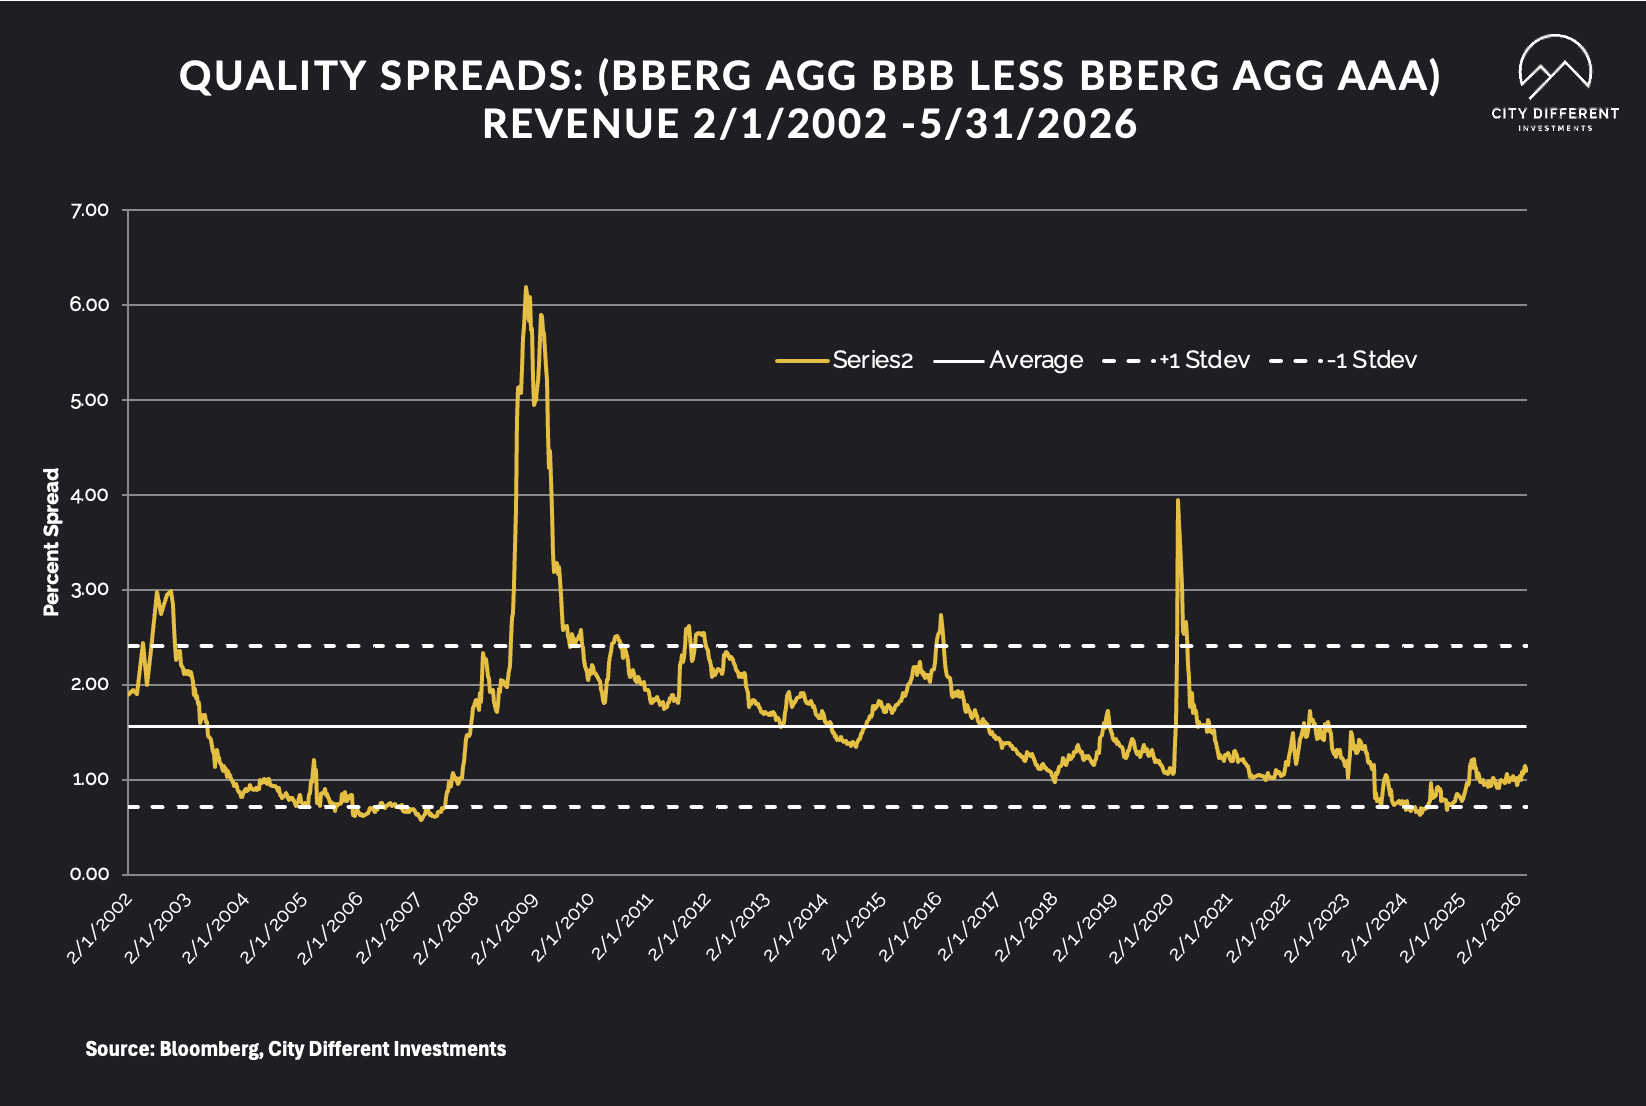
Investment-grade spreads for the past week were at 72 basis points. The long-term average for investment grade is 1.56%. High-yield credit spreads are 2.55%.
WHERE ARE FIXED-INCOME INVESTORS PUTTING THEIR CASH?
Money Market Flows (millions of dollars)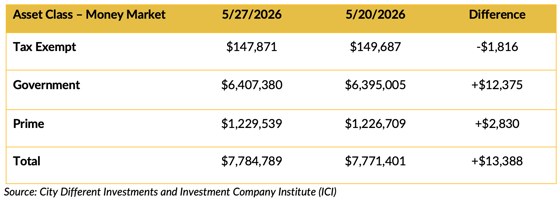
Money market fund flows were positive overall but nuanced underneath that. Tax-exempt money market was negative last week.
Mutual Fund Flows (millions of dollars)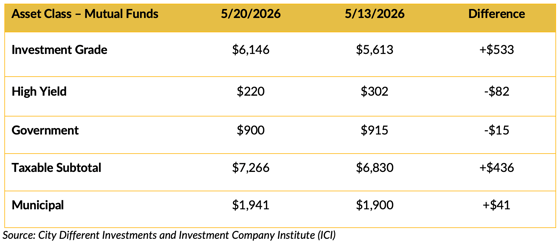
Mutual fund flows were positive overall. However, high yield and government funds saw negative flows.
ETF Fund Flows (millions of dollars)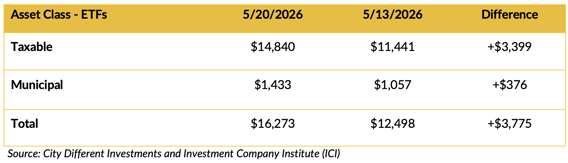
Net ETF flows were positive week over week.
SUPPLY OF NEW ISSUE BONDS
Supply continues to dominate the muni market. YTD tax-exempt issuance has been at $46 billion. This week’s calendar is extremely robust at $16 billion. June is a strong supply month for munis, but it has been met with strong demand. YTD muni fund flows are well above $40 billion.
CONCLUSION
Last week, the bond markets rallied on Iran peace talk optimism. The Q2 GDP forecast points to resilient U.S. growth. Inflation is running above target on every measure that matters to the market, even if the Dallas Fed’s trimmed mean tells a more constructive story. The Fed is divided. And the new chair has yet to speak publicly in his new role.
IMPORTANT DISCLOSURES
The information and statistics contained in this report have been obtained from sources we believe to be reliable but cannot be guaranteed. Any projections, market outlooks or estimates presented herein are forward-looking statements and are based upon certain assumptions. Other events that were not taken into account may occur and may significantly affect the returns or performance of these investments. Any projections, outlooks or assumptions should not be construed to be indicative of the actual events which will occur. These projections, market outlooks or estimates are subject to change without notice.
Please remember that past performance may not be indicative of future results. Different types of investments involve varying degrees of risk, and there can be no assurance that the future performance of any specific investment, investment strategy, or product or any non-investment related content, made reference to directly or indirectly herein will be profitable, equal any corresponding indicated historical performance level(s), be suitable for your portfolio or individual situation, or prove successful. Due to various factors, including changing market conditions and/or applicable laws, the content may no longer be reflective of current opinions or positions.
All indexes are unmanaged, and you cannot invest directly in an index. Index returns do not include fees or expenses. Actual portfolio returns may vary due to the timing of portfolio inception and/or investor-imposed restrictions or guidelines. Actual investor portfolio returns would be reduced by any applicable investment advisory fees and other expenses incurred in the management of an advisory account.
You should not assume that any discussion or information contained herein serves as the receipt of, or as a substitute for, personalized investment advice from City Different Investments. To the extent that a reader has any questions regarding the applicability above to his/her individual situation or any specific issue discussed, he/she is encouraged to consult with the professional advisor of his/her choosing. City Different Investments is neither a law firm nor a certified public accounting firm and no portion of this content should be construed as legal or accounting advice.
A copy of City Different Investments' current written disclosure statement discussing our advisory services and fees is available for review upon request.
Unless otherwise noted, City Different Investments is the source of information presented herein.
A description of the indices mentioned herein is available upon request.