
Don’t have time for one more New Year’s top-10 list? How about just a top 5?
Right now, everyone is making 2022 stock and bond market forecasts. But some are falling into a trap called “recency bias”—the tendency to overemphasize recent events when we try to predict the future. Recency plays a huge role in shaping relative valuations and deciding what’s “hot” in today’s market.
The trouble is, trends continue until they don’t. We believe successful investing is a practice best measured over decades, not just years. Otherwise, if you considered only the past 10 years of market performance, you’d likely arrive at some pretty interesting conclusions, such as:
1. Investing is easy.
Given their performance over the past decade, why would you invest in anything other than Tesla, Apple, and Bitcoin? Why bother diversifying away from these core holdings? For more details on this focused strategy, talk to my father-in-law. He’s a doctor by training but has crushed it in the market over the last decade following this approach. Or you can check out www.arkinvest.com. You’ll probably find exactly the kind of flashy industry disruptor you’re looking for.
Below is 10-year return profile of Bitcoin, Tesla, Apple and the S&P 500.
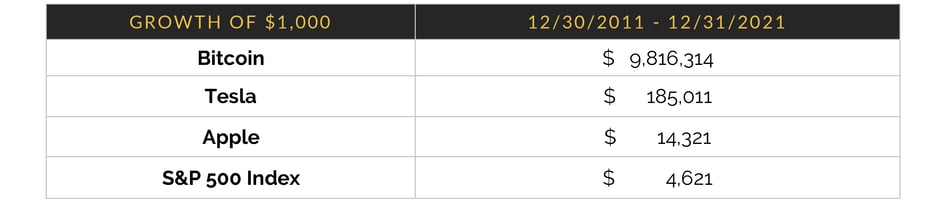
Sources: Bloomberg, statmusemoney, City Different Calculations
2. Interest rates only go down.
Look back even longer than a decade if you want to, and you’ll still see 40 years of declining interest rates. As interest rates fall, so do discount rates. Strong moats and fast growth for extended periods are wildly valuable as the discount rate approaches zero. Valuation almost doesn’t matter— just buy what will grow fastest for the longest and sleep easy.
The question is, what happens to this calculus as interest rates increase?
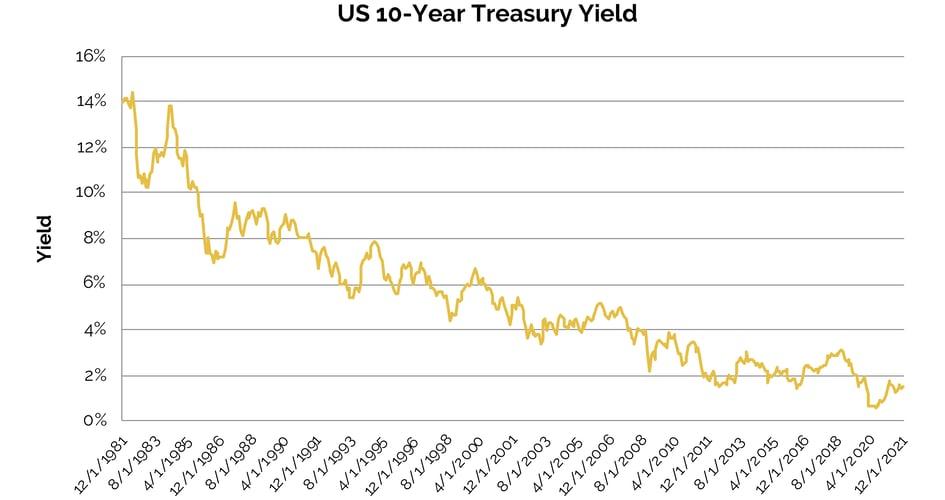
Sources: Bloomberg
3. Value is a dirty word.
The following chart illustrates the growth of $1,000 in the Russell 1000 Value Index, the Russell 1000 Growth Index and the Russell 1000 Index.
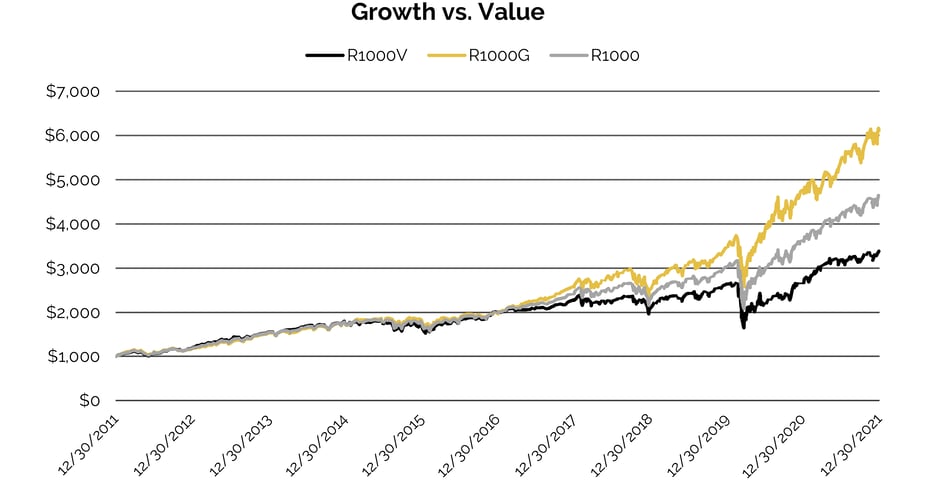
Source: Bloomberg
Fama, Eugene F., and Kenneth R. French. 1992a. The cross-section of expected stock returns. Journal of Finance 47.
Fama, Eugene F., and Kenneth R. French. 1992b. The economic fundamentals of size and book-to-market equity. Working paper
(Graduate School of Business. University of Chicago. Chicago. IL).
For the past ten years, growth has grabbed all the glory, while value investors have shyly shuffled off to the corner, hoping their day will come again.
It will. Style cycles don’t last forever. In fact, over the very long-term, value stocks have outperformed growth stocks. Paying less for a business can offer a margin of safety and lead to better long-term outcomes, as illustrated in the next chart.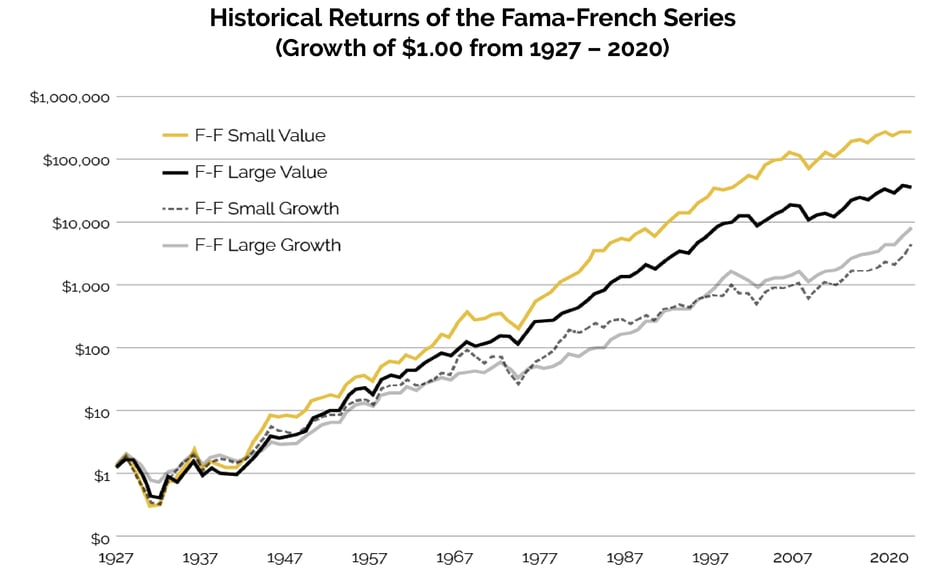
Source: Duff & Phelps Stocks, Bonds, Bills and Inflation (SBBI)
4. Bigger is always better.
The chart below details the growth of $1,000 in the S&P 500 Index and the Russell 2000 Index over the past 10 years.
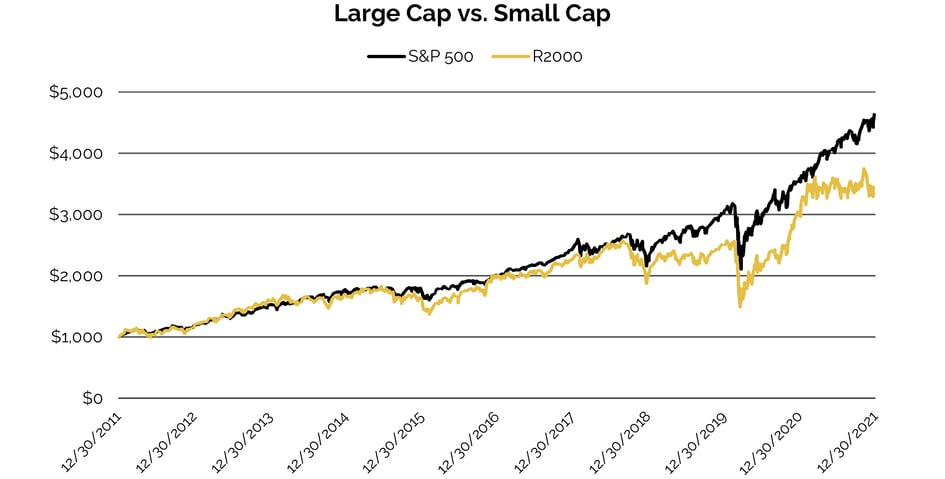
Source: Bloomberg
Today big companies rule the world, and they reward their investors richly. But big companies aren’t typically drivers of growth and innovation.
When looking at the past several decades, small-cap stocks have outperformed large-cap stocks. There is generally additional volatility and risk associated with small-cap investing, so it follows that investors would receive higher expected returns in this asset class.
5. Experts are idiots.
It has been a terrible decade for active stock pickers going up against the S&P 500 Index. In 2021, for example, 85% of active managers benchmarked against the S&P underperformed their index, according to this recent WSJ article.
We’ve heard many say that there are no longer inefficiencies in large-cap US stocks for active managers to exploit. We’re excited to test this theory over the next decade. UBS has constructed a model that predicts whether active managers benchmarked against the S&P 500 Index will outperform. These managers have more exposure to small caps, international stocks, and cash—which is why they tend to underperform when large caps and US stocks outperform and when market returns are high.
Our own best guess for the decade ahead? It’s not going to be different this time. Many of the same factors that led to the Internet Bubble and other speculative excesses seem at play again today. One of our team members received a free NFT when he signed up for a new service months ago. It was a short clip of a mediocre NBA player making a layup. He just sold that NFT for $400.
Things that can’t go on forever, don’t.
Granted, we don’t believe investors can buy deep-value stocks blindly and expect good results. But many of the lessons that retail and professional investors have learned over the last decade are not likely to serve them as well over the next one.
IMPORTANT DISCLOSURES
The information and statistics contained in this communication have been obtained from sources we believe to be reliable but cannot be guaranteed. Any projections, market outlooks or forecasts discussed herein are forward-looking statements and are based upon certain assumptions. Other events that were not taken into account may occur and may significantly affect the returns or performance of these investments. Any projections, outlooks or assumptions should not be construed to be indicative of the actual events which will occur. These projections, market outlooks or estimates are subject to change without notice. Please remember that past performance may not be indicative of future results. Different types of investments involve varying degrees of risk, and there can be no assurance that the future performance of any specific investment, investment strategy, or product, or any non-investment related content, made reference to directly or indirectly in this communication will be profitable, equal any corresponding indicated historical performance level(s), be suitable for your portfolio or individual situation or prove successful. Due to various factors, including changing market conditions and/or applicable laws, the content may no longer be reflective of current opinions or positions. No discussion or information contained herein serves as the provision of, or as a substitute for, personalized investment advice. To the extent that a reader has any questions regarding the applicability above to his/her individual situation of any specific issue discussed, he/she is encouraged to consult with the professional advisor of his/her choosing. City Different Investments is neither a law firm nor a certified public accounting firm and no portion of this content should be construed as legal, tax, or accounting advice.