.png)

WEEK ENDING 10/27/2023
- Market focus shifting away from the Federal Reserve
- A primer on the tension between monetary and fiscal policies
- Return of the soft landing v. hard landing debate
A CITY DIFFERENT TAKE
The biggest event this week should have been the Federal Reserve meeting on Wednesday. However, because of the Fed's guidance that it would hold rates for this meeting, the focus shifted to other events. The Fed has not ruled out future hikes and rates are the highest they have been in 22 years. We have one more meeting left for this year in December, but Fed funds futures predict a rate increase more likely in January, priced at 40% probability.
The $57 trillion fixed income market is keen on the Treasury's borrowing plan. Market curiosity is around long-term issuance by the Treasury to fund the widening U.S. budget deficit, which currently stands at $1.7 trillion in FY 2023.
Here is a short primer on Treasury vs. Fed (or a very exciting turn of events between monetary and fiscal policy):
Let’s start with the federal deficit, currently at around 6.3% of GDP for FY 2023. Deficits were easier to finance while interest rates stayed closer to 0%. The Federal Reserve, prior to 2023, was a net buyer of Treasuries. Fast forward to October 2023, with Federal Fund Rates topping closer to 5.50%, selling Treasury bonds becomes very expensive for the Treasury. Much like a first-time homebuyer, the U.S. Treasury, too has to contend with the Fed's guidance of “higher for longer.” We would be remiss if we didn’t also mention quantitative tightening, where the Fed is running off Treasuries at a pace of $60 billion a month.
How has the bond market reacted to all of this? In October, the 10-year Treasury yields have climbed by 27 basis points. This has been the sixth straight month of rising yields. For some time, we have been talking about the 2s10s (the 10-year and 2-year) curve inversion. As 10-year yields climb, we are seeing a steepening of the yield curve and a move towards dis-inversion.
So, for this week, while the market knows the Federal Reserve is holding rates, attention turns to Treasury supply. Let’s indulge market speculation around supply, which is predicting a Treasury refunding close to $114 billion.
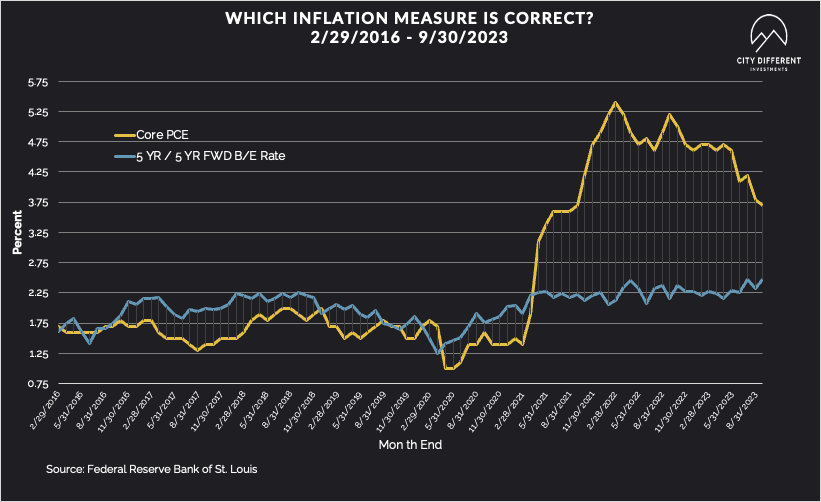
As far as a recap of last week, Core PCE data showed continued signs of inflation in the economy. Core PCE increased 0.3% month over month. Headline PCE is near 3.5%. The same goes for the Fed's recent favorite measurement “supercore” which still looks high.
In a turn of events for inflation, the market’s preoccupation is no longer focused on Fed policy but rather on what inflation means for the economy. We return to one of our favorite questions: will we see a soft landing or a hard landing? In that sense, Friday’s data supported another month of inflation converging to 3% to 3.5%, far off last year’s peak (though still short of the Fed’s 2% target).
What do we think about this at City Different? We believe the economy will slow from its rapid Q3 growth rate. (The economy grew at 4.9% in the third quarter.) But the current economy and consumer is showing remarkable resilience. Job growth is strong, and cooling wage pressures suggest a better balance between labor supply and labor demand.
CHANGES IN RATES
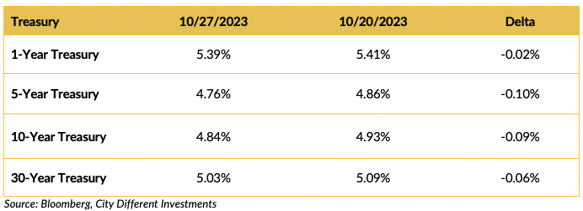
Treasury yields moved lower on the week. The specter of a growing economy (4.9% third quarter GDP compared to 2.1% the prior quarter) was offset by another decline in Y/Y Core PCE, 3.7% versus a downward adjusted 3.8% for the prior month. The 10/2 Treasury spread barely moved on the week, closing at -0.15%.
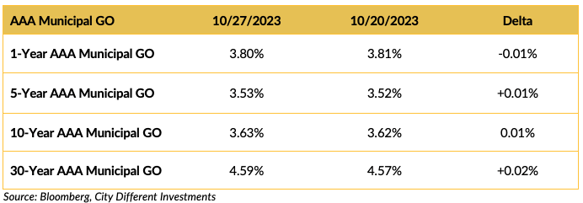
The municipal bond market was close to unchanged on the week.
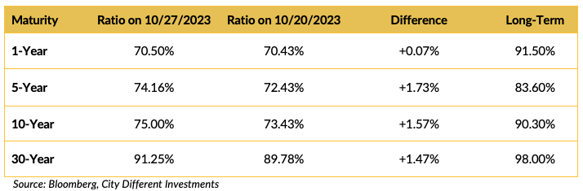
The municipal/Treasury ratios are higher in the longer end of the market.
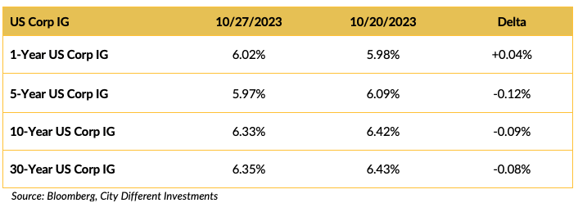
Corporate yields moved lower last week.
THIS WEEK IN WASHINGTON
.png?width=1920&name=graphs%20in%20order%20(1).png)
22 days after Kevin McCarthy was removed from the role, we have a new House Speaker: Rep. Mike Johnson. Speaker Johnson is a Louisiana Republican and until recently was the vice chair of the House Republican conference. The most immediate to-do on the Speaker's list is funding the government before the November 17 deadline. In addition, it is to work with the president and his party on the $106 billion in emergency funding for Ukraine, Israel, and Taiwan.
In global news, there is too much to follow. Geopolitical risks remain elevated in the Middle East. The U.S. has launched attacks on Iran-linked groups in Syria while Israeli tanks have entered Gaza City, cutting off key roads.
Finally, the Bank of Japan (BOJ) is worth noting here. Amid a backdrop of rising U.S. rates, the BOJ has considered tweaking current policies to allow 10-year yields to exceed 1%, which would replace the previous cap of 0.5%.
WHAT, ME WORRY ABOUT INFLATION?
The 5-year Breakeven Inflation Rate finished the week at 2.45%, two basis points lower than the October 20 close of 2.47%. The 10-year Breakeven Inflation Rate finished the week at 2.42%, five basis point lower than the October 20 close.
MUNICIPAL CREDIT
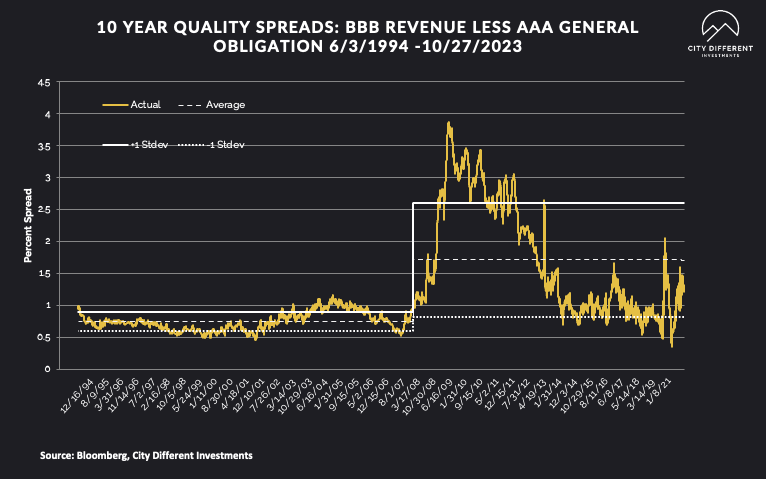
10-year quality spreads (AAA vs. BBB) as of October 27 was 1.32%, 11 basis points higher than the October 20 reading of 1.21% (based on our calculations). The long-term average is 1.71%.
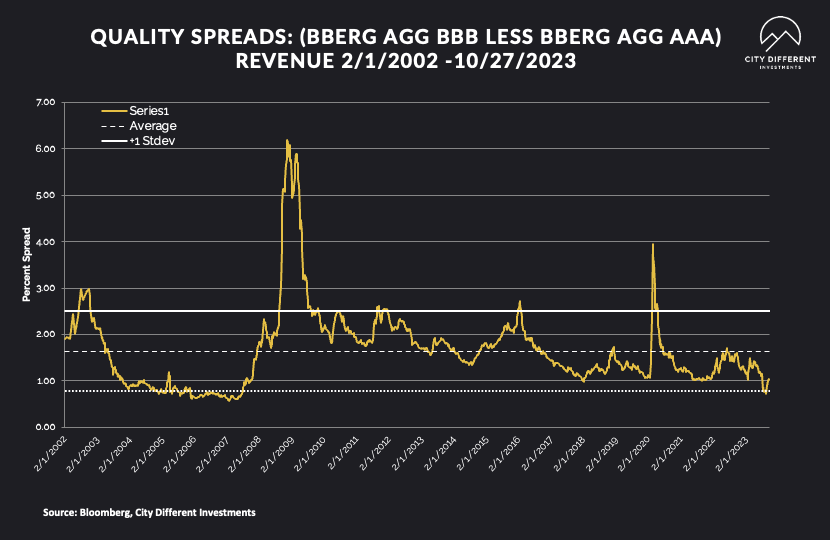
Quality spreads in the taxable market are not attractive but were wider last week, ending the week at 1.03%. High yield quality spreads moved from 3.86% on October 20 to 3.83% on October 27.
WHERE ARE FIXED-INCOME INVESTORS PUTTING THEIR CASH?
Money Market Flows (millions of dollars)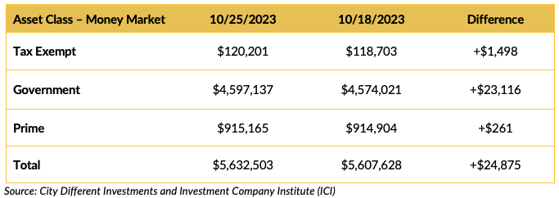
This week, market participants liked money market funds, and all categories saw positive flows.
Mutual Fund Flows (millions of dollars)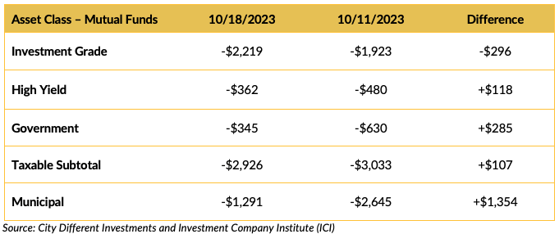
Bond mutual funds' cash flows were negative across the board.
ETF Fund Flows (millions of dollars)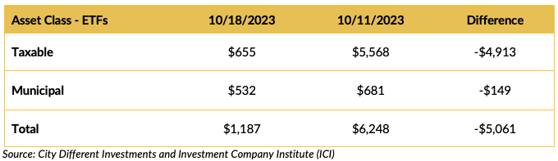
ETF flows were positive last week.
SUPPLY OF NEW ISSUE MUNICIPAL BONDS
This week’s supply estimates are slated for somewhere around $2.5 billion. This is the municipal market equivalent of the New Zealand All Blacks playing with one man down (14 players, instead of 15) due to a red card after a dangerous tackle against the South African Springboks in the Rugby World Cup finals.
Also, this is a big supply week for the U.S. Investment grade market. Expectations are that we will see supply range anywhere between $15 and $20 billion in bond sales this week.
CONCLUSION
This year-end is closing in quickly with still much to understand and digest. We have entered the Federal Reserve’s highest rate regime in 22 years. The market operates under the guidance of no new Fed rate hikes for November. Last week's Core PCE data shows overheated inflation figures. Finally, it’s going to be a big week with Treasury supply, Apple's launch event, Speaker Johnson, and the Middle East.
In short — Happy Halloween, folks.
IMPORTANT DISCLOSURES
The information and statistics contained in this report have been obtained from sources we believe to be reliable but cannot be guaranteed. Any projections, market outlooks or estimates presented herein are forward-looking statements and are based upon certain assumptions. Other events that were not taken into account may occur and may significantly affect the returns or performance of these investments. Any projections, outlooks or assumptions should not be construed to be indicative of the actual events which will occur. These projections, market outlooks or estimates are subject to change without notice.
Please remember that past performance may not be indicative of future results. Different types of investments involve varying degrees of risk, and there can be no assurance that the future performance of any specific investment, investment strategy, or product or any non-investment related content, made reference to directly or indirectly herein will be profitable, equal any corresponding indicated historical performance level(s), be suitable for your portfolio or individual situation, or prove successful. Due to various factors, including changing market conditions and/or applicable laws, the content may no longer be reflective of current opinions or positions.
All indexes are unmanaged, and you cannot invest directly in an index. Index returns do not include fees or expenses. Actual portfolio returns may vary due to the timing of portfolio inception and/or investor-imposed restrictions or guidelines. Actual investor portfolio returns would be reduced by any applicable investment advisory fees and other expenses incurred in the management of an advisory account.
You should not assume that any discussion or information contained herein serves as the receipt of, or as a substitute for, personalized investment advice from City Different Investments. To the extent that a reader has any questions regarding the applicability above to his/her individual situation or any specific issue discussed, he/she is encouraged to consult with the professional advisor of his/her choosing. City Different Investments is neither a law firm nor a certified public accounting firm and no portion of this content should be construed as legal or accounting advice.
A copy of City Different Investments' current written disclosure statement discussing our advisory services and fees is available for review upon request.
Unless otherwise noted, City Different Investments is the source of information presented herein.
A description of the indices mentioned herein are available upon request.