.png)

WEEK ENDING 8/9/2022
Highlights of the week:
• The Federal Reserve is committed to fighting inflation.
• Higher interest rates coupled with higher volatility makes for a tempting combination.
• Midterm election campaign season is in full swing. Could this be the spoon that stirs the investment pot?
A CITY DIFFERENT TAKE
Interest rates are higher, and the Fed is firmly committed to fighting inflation. Nothing in the last two weeks — be it data releases or speeches from Fed governors — appears to warrant a change in this strategy. This week’s CPI and PPI inflation releases, however, may change that read. Volatility is high. But this may present opportunities to investors with strong constitutions.
CHANGES IN RATES
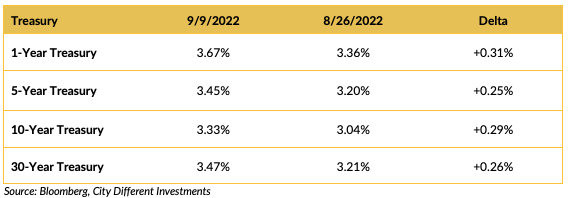
Interest rates in the Treasury market moved higher in the last two weeks. The slope of the yield curve is inverted 1 to 30 years. Following up on Chairman Powell’s Jackson Hole speech, almost all Fed commentary has been similar. To paraphrase, the Fed will fight inflation until the job is done.
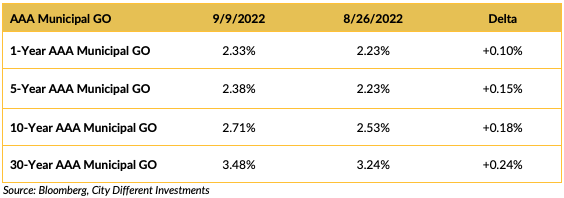
Municipal interest rates moved higher in the last two weeks, especially in the short end of the market. Even though they still lagged behind the Treasury market moves.
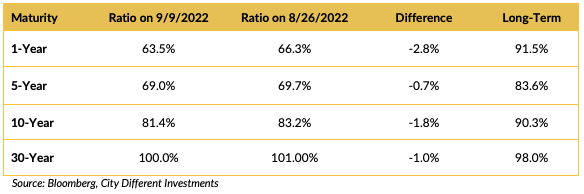
Muni-Treasury ratios were lower in the last two weeks. A higher M/T ratio tends to make Munis a more attractive buy.
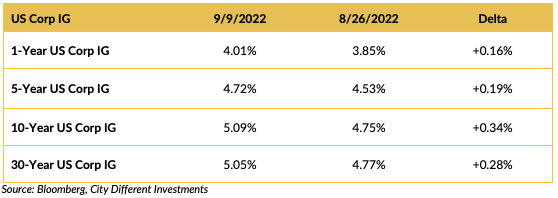
Investment-grade rates were higher in the last two weeks following the Treasury market’s lead.
THIS WEEK IN WASHINGTON

Well, now that we’ve passed Labor Day, midterm election campaigning has started full-time. Our recommendation is to stop listening to political speeches from both parties. List each side’s accomplishments, review the final tally, and then make your decision. It seems that truth and facts are the collateral damage of the election process. Alexis de Tocqueville summed up the situation rather nicely: “There are many men (and women) of principle in both parties in America, but there is no party of principle.”
WHAT, ME WORRY ABOUT INFLATION?
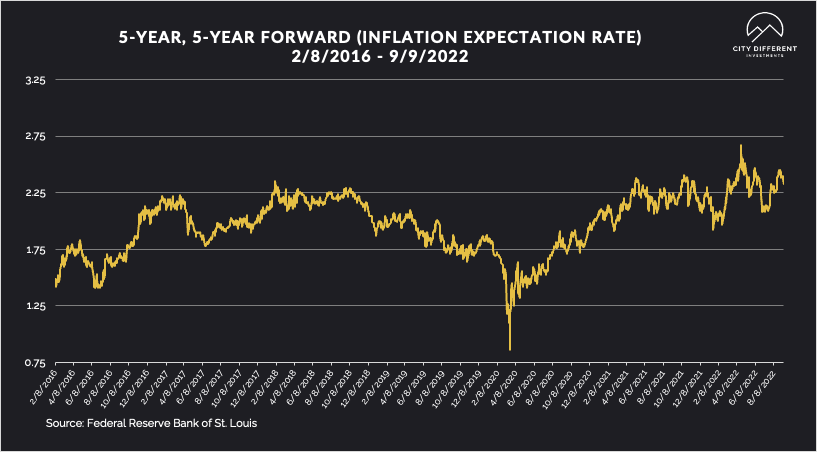
The 5-year Breakeven Inflation Rate ended the two-week period at 2.33%, 8 basis points lower than the prior closing of 2.41%. The same can be said for the 10-year Breakeven Inflation Rate ending the two-week period at 2.42%, 15 basis points lower than the last reported observation of 2.57%.
MUNICIPAL CREDIT
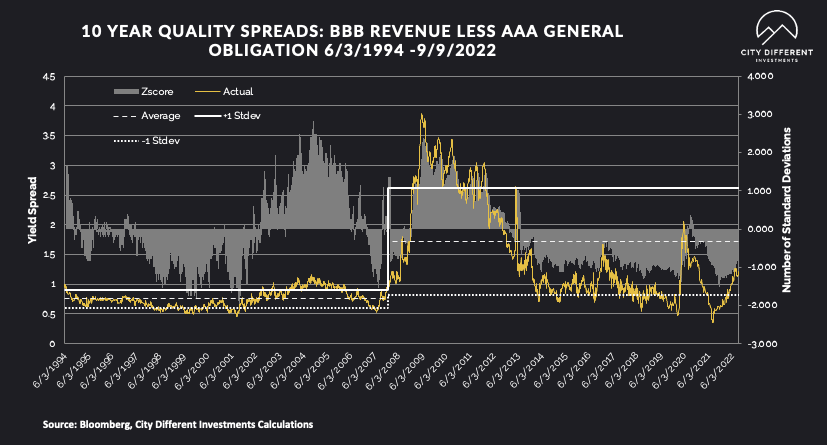
Quality spreads continued to widen, moving further into the fair range, and are starting to pique our interest. While we don’t think the move has been significant enough to change our strategic outlook towards credit, it's getting close.
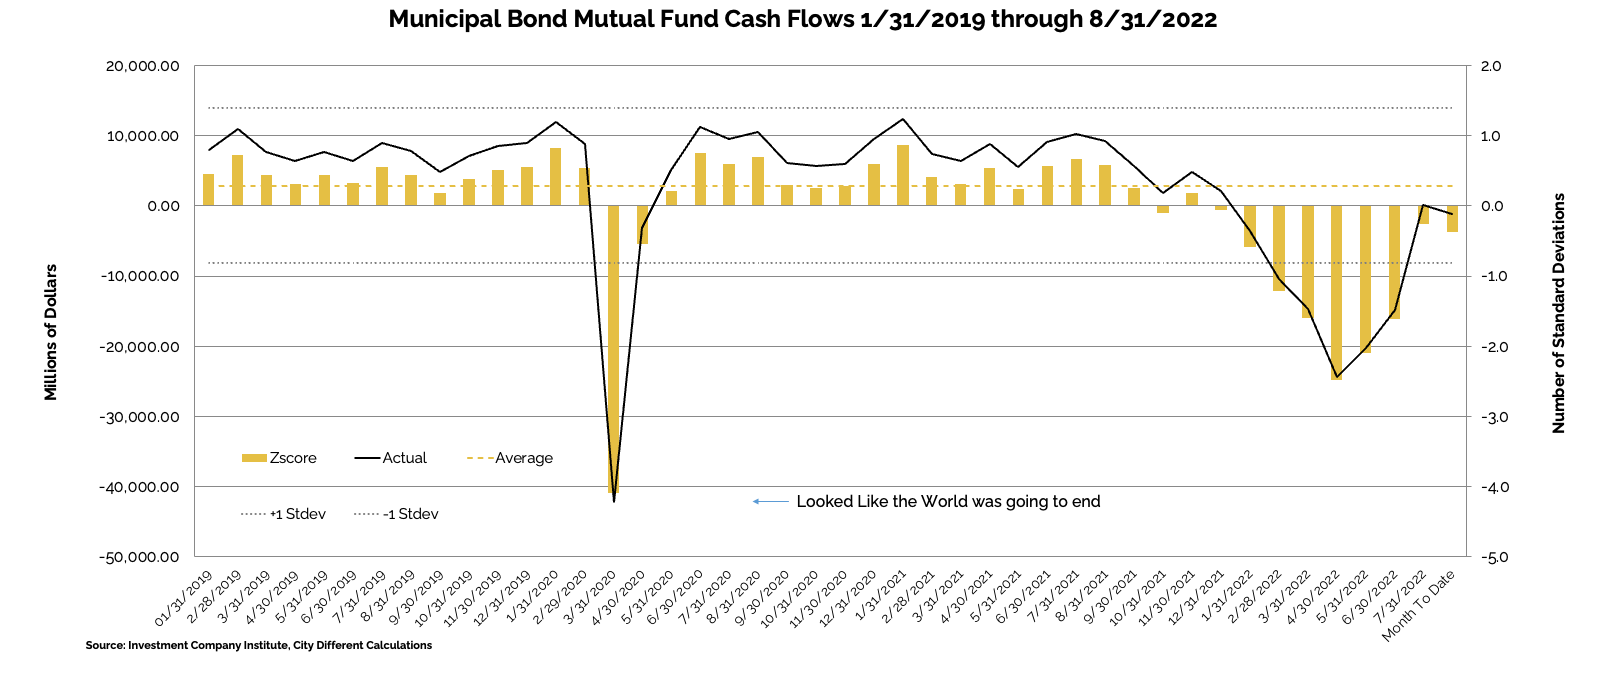
WHY IS THE MUNICIPAL MARKET BEHAVING THIS WAY?
Various sources are used to report cash flows related to municipal bond mutual funds and ETFs, all reporting at different times. The source we have chosen to use is the Investment Company Institute (I.C.I.). The I.C.I. reported weekly cash flows from municipal bond mutual funds for the week of August 31, as -$2.5 billion compared to -$765 million from the week before.
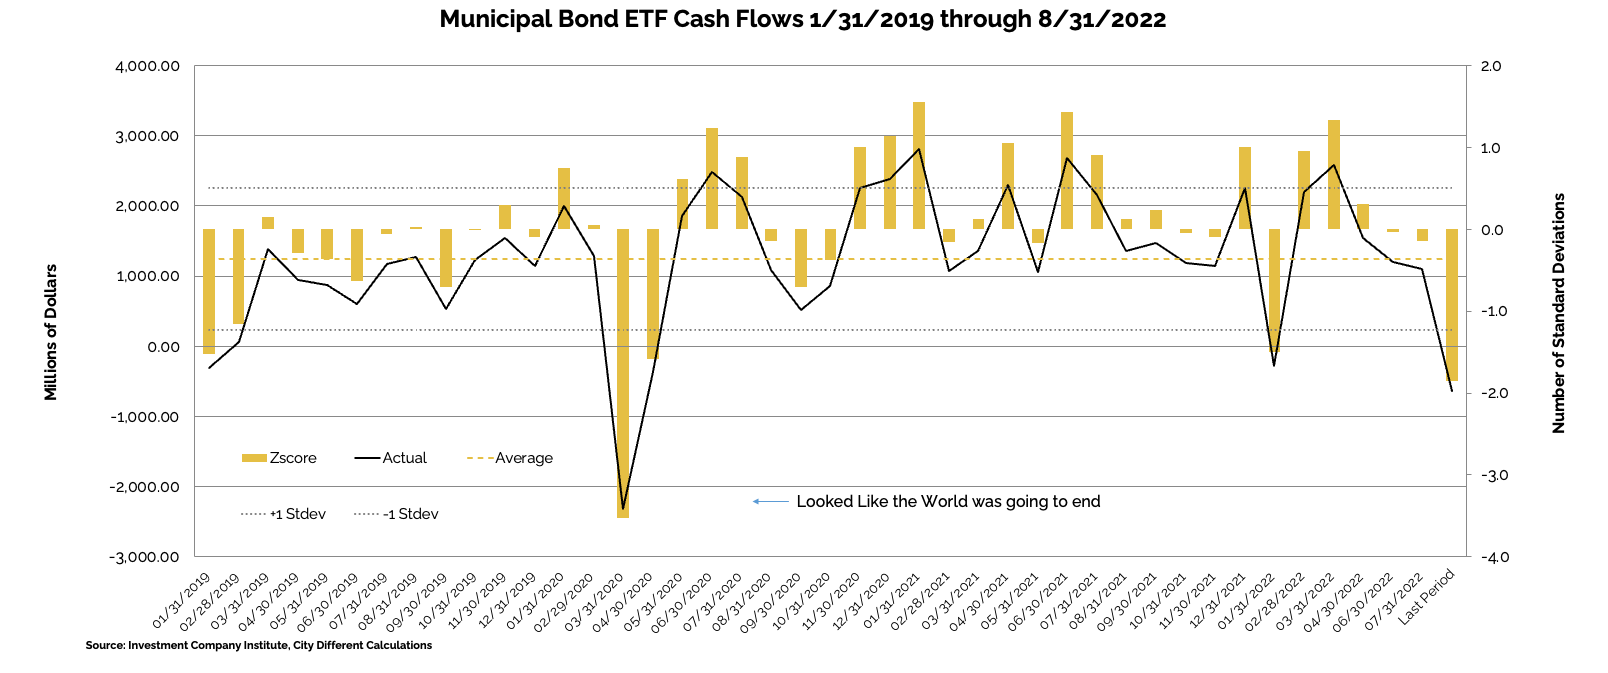
Municipal bond ETF cash flows for the same period were -$72 million, compared to -$337 million the prior week.
Other cash flow sources:
Lipper reported a fifth combined weekly and monthly outflow, with $697 million leaving Muni funds, increasing YTD outflows to a near record $84.4 billion.
SUPPLY OF NEW ISSUE MUNICIPAL BONDS
In its Municipal Markets Weekly newsletter, JP Morgan commented on the supply picture this week, stating that:
“Next week, we expect total supply of $8.9 billion, or 88% of the equivalent week 5-year average ($10.1 billion). We anticipate tax-exempt supply of $7.8 billion (99% of average), while taxable/corp cusip supply of $1.1 billion (54% of the average) remains subdued.”
The supply picture does not get interesting until it exceeds $10 billion tax-exempt issuances in a given week.
CORPORATE INVESTMENT GRADE AND HIGH YIELD OVERVIEW
In U.S. Investment Grade land, new issue activity has petered out as the fixed income market digests the volatility.
In its weekly "Credit Flows" report, Wells Fargo commented:
“The Odd De-couple. This week saw a striking breakdown in the positive correlation between interest rates and credit spreads seen this year, as 10-year Treasury yields rose 10bps to 3.29% while CDX IG tightened 10bps to 82bps. In contrast prior to that, for example since mid/late March rates rose 90bps while the index widened 20bps. There is a similar breakdown between rates and CDX HY, but since the latter is quoted in price the chart would not support the title of this piece. Had this relationship not broken down either 10-year Treasury yields should be much lower at 2.83% or CDX IG spreads materially wider at 97bps. We think both the ECB President and Fed Chair were very clear this week in signaling significant further monetary policy tightening ahead. The rates market understood these hawkish messages while credit did not. We’re looking for a re-coupling between rates and credit with the latter doing the bulk.
Passing the baton to the ECB. One reason for decoupling is that the rates market more accurately reflects the importance of the remarkable hawkish shift at the ECB as the increase in European interest rates effectively un-anchors Treasury yields via global investment flows. We are led to believe that credit investors — in the US but also Europe as we saw similar tightening moves in main and xover — are simply underestimating the negative consequence of the hawkish Fed/ECB stance and resulting upside risk to interest rates — and deterioration of corporate profits. Bearish on credit.
The world is flat. Even though compression between Treasury and bund yields suggests the former are relatively less attractive that does not translate into US corporate bonds becoming even more unattractive to their EUR counterparts, as with flat rates curves the cost of hedging USD exposure into EUR declined similarly.
Leveraged to growth. Despite improving corporate leverage ratios, the sensitively of fundamentals to earnings growth has become pronounced after nearly two years of ultra-loose financial conditions, and there is a clear risk that fundamentals could deteriorate rather quickly over the next 12 months.
The race to retrace. Since mid-August, asset classes have retraced varying proportions of their summer bear market rallies. Treasuries have retraced almost all of its summer rally and are close to cycle lows, while US and Euro HY spreads have retraced only about one-third to one-fourth of their summer rallies. Asia IG continues to trade near summer tights.
Data section: Quality spreads from A-AA rated through CCC-B for US and EUR corporate bonds. Also show relative value between USD vs EUR and US vs Asia credit.”
CONCLUSION
Due to higher levels of new issue supply, the municipal bond market typically underperforms in the fall. We have positioned all our SMAs short of their midpoint neutral positions. We will look to extend their duration this fall as opportunities present themselves.
.png?width=500&name=signature%20block%20(3).png)
IMPORTANT DISCLOSURES
The information and statistics contained in this report have been obtained from sources we believe to be reliable but cannot be guaranteed. Any projections, market outlooks or estimates presented herein are forward-looking statements and are based upon certain assumptions. Other events that were not taken into account may occur and may significantly affect the returns or performance of these investments. Any projections, outlooks or assumptions should not be construed to be indicative of the actual events which will occur. These projections, market outlooks or estimates are subject to change without notice.
Please remember that past performance may not be indicative of future results. Different types of investments involve varying degrees of risk, and there can be no assurance that the future performance of any specific investment, investment strategy, or product or any non-investment related content, made reference to directly or indirectly herein will be profitable, equal any corresponding indicated historical performance level(s), be suitable for your portfolio or individual situation, or prove successful. Due to various factors, including changing market conditions and/or applicable laws, the content may no longer be reflective of current opinions or positions.
All indexes are unmanaged, and you cannot invest directly in an index. Index returns do not include fees or expenses. Actual portfolio returns may vary due to the timing of portfolio inception and/or investor-imposed restrictions or guidelines. Actual investor portfolio returns would be reduced by any applicable investment advisory fees and other expenses incurred in the management of an advisory account.
You should not assume that any discussion or information contained herein serves as the receipt of, or as a substitute for, personalized investment advice from City Different Investments. To the extent that a reader has any questions regarding the applicability above to his/her individual situation or any specific issue discussed, he/she is encouraged to consult with the professional advisor of his/her choosing. City Different Investments is neither a law firm nor a certified public accounting firm and no portion of this content should be construed as legal or accounting advice.
A copy of City Different Investments' current written disclosure statement discussing our advisory services and fees is available for review upon request.
Unless otherwise noted, City Different Investments is the source of information presented herein.
A description of the indices mentioned herein are available upon request.