.png)

WEEK ENDING 07/29/2022
Highlights of the week:
- Second-quarter GDP is negative, but are we in a recession?
- Federal Reserve increases short-term rates by 0.75%.
- The four most dangerous words in the investment management industry: “This time, it’s different.” But all recessions are not the same.
A CITY DIFFERENT TAKE
This was a busy week. The Federal Reserve raised its short-term interest rate target by 0.75%. Second-quarter GDP came in negative for the second quarter in a row. That trend is a shorthand determination of a recession — though that shorthand is not shared by the National Bureau of Economic Research (NBER), the official arbitrager of recessions.
Officially, the NBER defines a recession as “a significant decline in economic activity that is spread across the economy and lasts more than a few months.” In fact, the bureau’s economists profess to not factor in gross domestic product — the broadest measure of activity — as a primary barometer.
The debate now centers on the question, “is the US economy already in a recession?”
Interest rates in the fixed income markets continued to move lower throughout the week. In addition, many other economic releases were weaker. The latest consumer confidence reading was lower (95.7 versus 98.7). Month-over-month new home sales were down (-8.1% versus +10.7%). The Fed’s favorite inflation measure — the Year-over-year Personal Consumption and Expenditure Index (PCE) — increased (+4.8% versus +4.7%).
This all translates to a negative real interest rate of -2.07% versus a long-term average of +1.52% for a ten-year tax-exempt AAA general obligation bond (a -2.48 standard deviation event, for those playing along). In comments following their decision to increase rates, the Fed stuck to its 2% inflation target. In our opinion, this seems similar to Chris’s desire to be 25 years old, six-foot-four, 250 pounds, and cut. (Only one of those things stands a chance of happening.)
On the other side of the equation, the M2 money supply is only down 0.65% from its March 1 peak, according to the June report. April’s quarterly reading of velocity of M2 is up 2.23% over the January reading. Unemployment is still running at 3.6%, with more than 10 million unfilled jobs in this country. (Anecdotally, we recently talked to a local entrepreneur who mentioned he was having difficulty filling 25 open positions.) We will get more information about the employment picture this Friday.
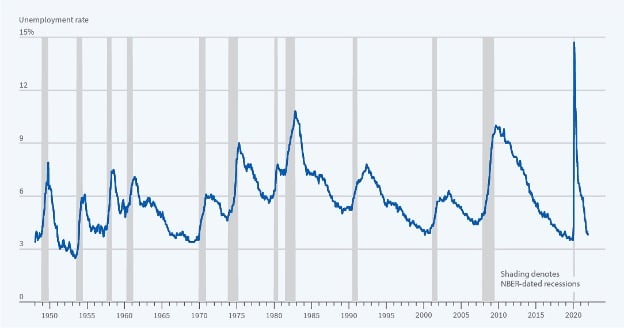
The most dangerous phrase in the investment management business is, “this time, it’s different.” But all comparisons to recent recessions ignore the fact that this is the first time since 1918 the U.S. economy is recovering from a pandemic (and the U.S. economy is undoubtedly different than it was in 1918). In short, the US economy still has historic levels of money (M2) in circulation and still suffers from supply chain disruptions (just try to buy a car or fly on a holiday weekend). Not all recessions are the same, as the graph below from the NBER illustrates:
 Source: National Bureau of Economic Research (NBER)
The blue line is the unemployment rate, and the shaded areas indicate recessions, as defined by the NBER.
The economic picture is muddy at best, and this has caused us to rethink the strategic positioning of our separately managed accounts (SMAs). Please see the conclusion for further discussion.
CHANGES IN RATES
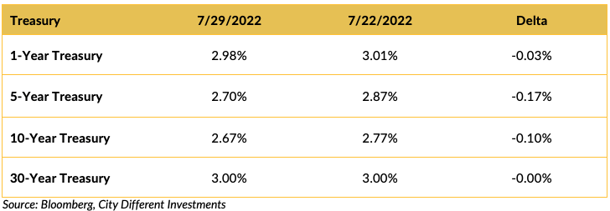
Rates in the Treasury market moved lower again last week. The yield curve remained very flat in 1 – 30 years. Is this a precursor to a recession? As we said last week, we don’t think so (despite the Biden administration trying to redefine the definition). Our confidence in that position is indeed being tested. The Federal Reserve met last week and increased its short-term interest rate target by 0.75%.
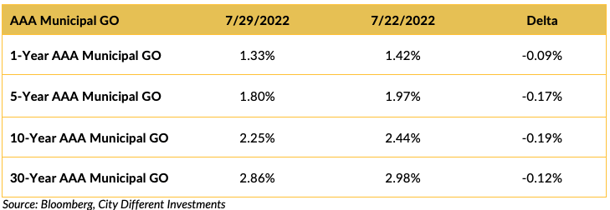
Rates in the municipal market decreased in the last week, aided by a negative GDP report for the second quarter and limited new issue supply.
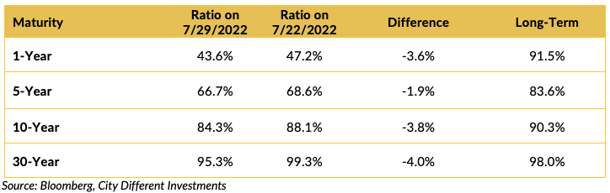
Muni-Treasury ratios decreased across the curve in the last week. The municipal market's front end looks unattractive compared to its Treasury equivalents. A higher M/T ratio tends to make Munis a more attractive buy.
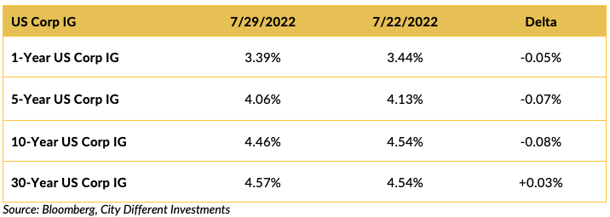
Investment-grade rates were mostly lower last week following the Treasury market’s lead.
THIS WEEK IN WASHINGTON

It was a busy week in Washington.
President Biden is back in quarantine. CNN reported:
President Joe Biden tested positive for COVID-19 again Saturday morning, per a letter from presidential physician Dr. Kevin O'Connor, in what is likely a “rebound” positivity that the doctor noted is “observed in a small percentage of patients treated with Paxlovid.”
Sen. Joe Manchin (D-WV) and U.S. Senate majority leader Chuck Schumer (D-NY) seem to have struck a deal on the climate change bill Manchin earlier killed. According to Barron’s, the deal on the $739 billion bill known as the Inflation Reduction Act will:
- Give Medicare the power to negotiate prescription drug prices — an estimated $290 billion in savings.
- Lower Affordable Care Act premiums for the next three years.
- Set aside $369 billion for clean energy initiatives.
- Set a 15% minimum corporate tax rate on companies with income of $1 billion or more.
- Close the carried interest loophole.
- Increase funding for the IRS.
Speaker Nancy Pelosi’s reported stopover in Taiwan spurs increased tensions with China.
Speaker Nancy Pelosi is set to leave this weekend on a trip that includes Singapore, Japan, and South Korea — and possibly Taiwan — even as a Chinese state media commentator suggested Friday that Beijing could shoot down any U.S. military plane she takes to Taipei.
"If U.S. fighter jets escort Pelosi's plane into Taiwan, it is invasion," Hu Xijing, who writes for the state-run Global Times, tweeted in response to a CNN article saying that Pelosi plans to depart for Asia on Friday. "The [Chinese Army] has the right to forcibly dispel Pelosi's plane and the U.S. fighter jets, including firing warning shots and making tactical movement of obstruction. If ineffective, then shoot them down.”
Gun manufacturers testified before Congress, which gave elected officials a new opportunity to contextualize the gun problem in this country. C-SPAN reported Rep. Jody B. Hice (R-GA) made the following comparison:
“We have not dealt with one of the issues, this is like the old saying that we are going to blame the manufacturers of forks and spoons for obesity. I guess you are going to subpoena some of them as well, to deal with obesity and this country. An absolutely absurd that we are not dealing with the issue…”
Now, some of you older readers may not have heard that “old saying” before. “Absolutely absurd” is right. Rarely do a fork and spoon kill 19 children and two teachers while good people wait in the halls. In our minds, a more fitting analogy would be the responsibilities of drug manufacturers for the opioid crisis.
WHAT, ME WORRY ABOUT INFLATION?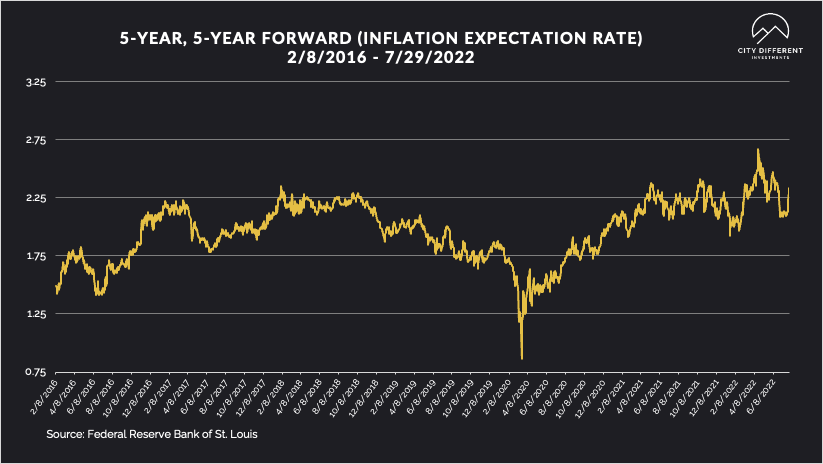
The 5-year Breakeven Inflation Rate ended the week at 2.33%, 21 basis points higher than last week’s closing 2.12%. The same can be said for the 10-year Breakeven Inflation Rate ending the week at 2.53%, 19 basis points higher than last week’s 2.34%. These are pretty significant moves and don’t seem to support the rate moves we have seen in the fixed income markets.
MUNICIPAL CREDIT
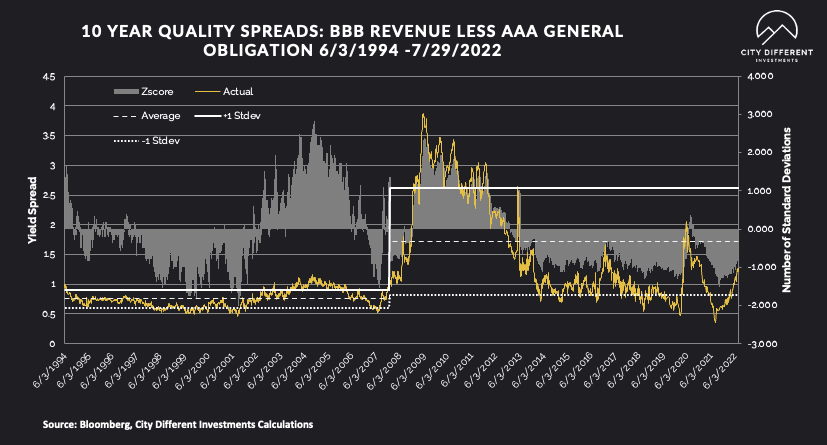
Recession fears are having an impact on the credit markets. Quality spreads continued to widen, moving further into the fair range. While we don’t think the move has been significant enough to change our strategic outlook towards credit, it's getting close.
Other credit comments from JP Morgan:
“2021 Muni defaults remained low. Over a 10-year horizon, the cumulative rate of default for all rated bonds in the municipal market is 0.2%, compared to 7.8% for bonds in the corporate market and 5.8% for sovereign debt.”
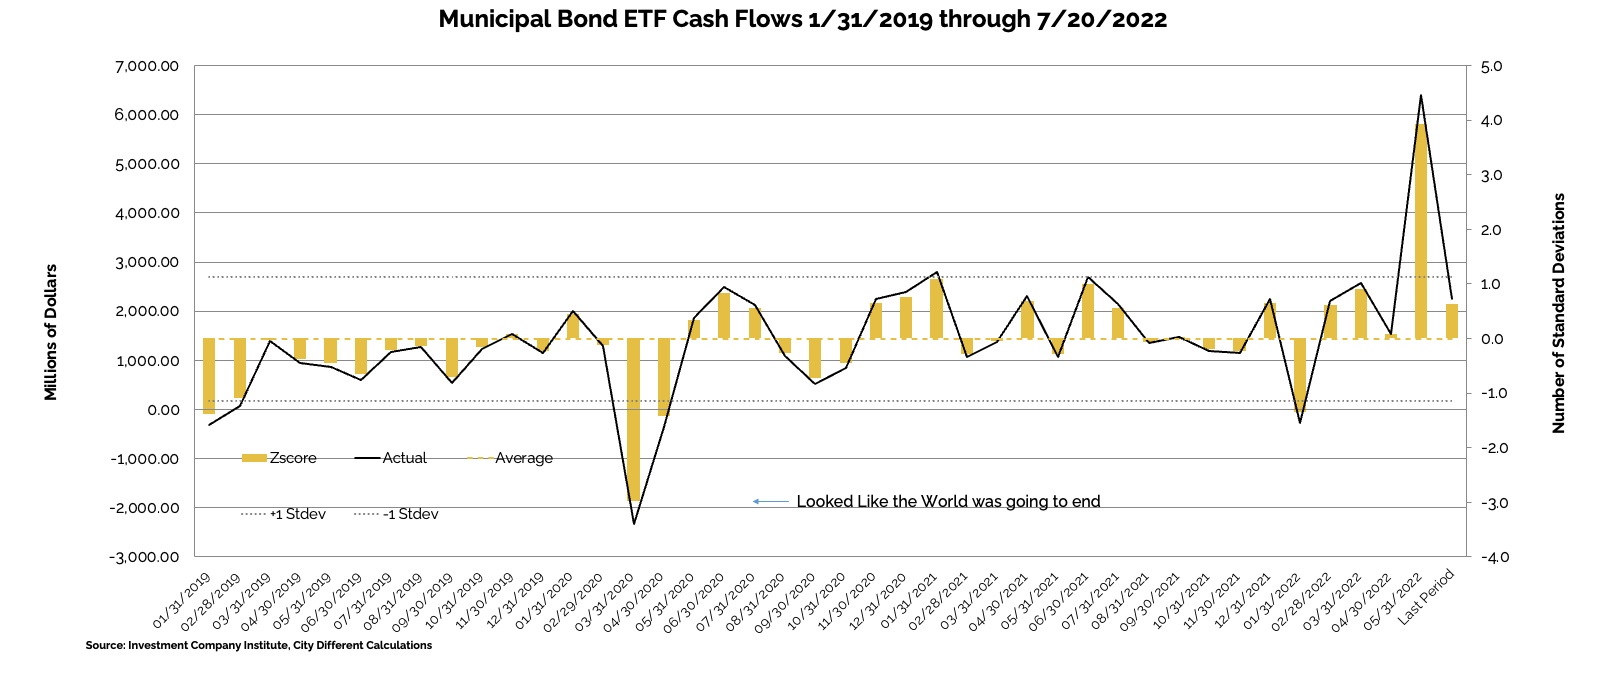
WHY IS THE MUNICIPAL MARKET BEHAVING THIS WAY?
Various sources are used to report cash flows related to municipal bond mutual funds and ETFs, all reporting at different times. The source we have chosen to use is the Investment Company Institute (I.C.I.). The I.C.I. reported weekly cash flows from municipal bond mutual funds for the week of July 13, as +$543 million compared to -$1.1 billion from the week before.
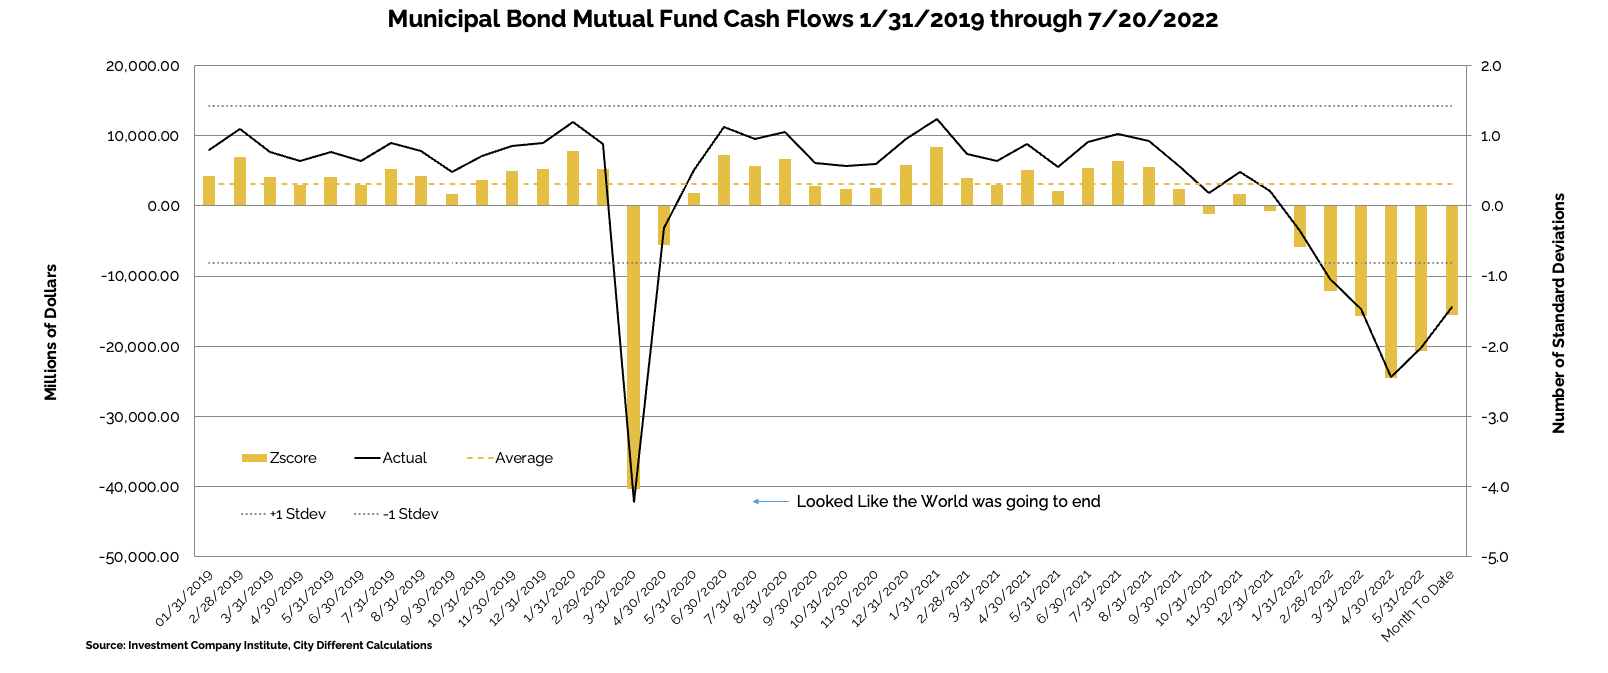
Municipal bond ETF cash flows for the same period were -$23 million, compared to -$347 million the prior week.
Other cash flow sources:
Lipper reported combined weekly and monthly inflows of $236 million for the period ending July 27, resulting in YTD outflows to $80.6 billion. This marks the first week of combined weekly and monthly inflows since the week ending January 5. Aggregate inflows were the result of $709 million into Municipal ETFs, while open-end funds saw $472 million of outflows.
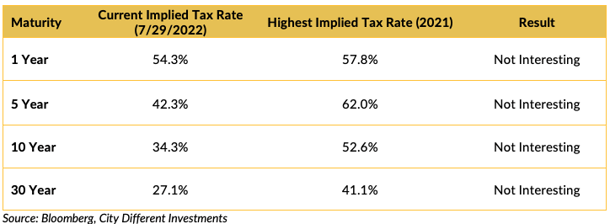
TAXABLE VS. TAX-EXEMPT MUNICIPAL BONDS
The implied tax rate for a taxable vs. a tax-exempt A.A. municipal bond in various maturities are as follows:
SUPPLY OF NEW ISSUE MUNICIPAL BONDS
In its Municipal Markets Weekly newsletter, JP Morgan commented on the supply picture this week, stating that:
“Next week we expect total supply of just $4.6 billion, or 61% of the 5-year equivalent week average ($7.6 billion). We anticipate tax-exempt supply of $4.2 billion (71% of average), while taxable/corp cusip supply of just $0.4 billion (16% of the average) remains subdued.”
The supply picture does not get interesting until it exceeds $10 billion tax-exempt issuances in a given week.
CORPORATE INVESTMENT GRADE AND HIGH YIELD OVERVIEW
In U.S. Investment Grade land, new issue activity has petered out as the fixed income market digests the volatility.
In its weekly "Credit Flows" report, Wells Fargo commented:
“When life gives you lemonade, make lemons. Today’s reading on the US Employment Cost Index for 2Q of 1.3%, which annualizes to 5.3%, is a reminder that the Fed is far from containing inflation. Because wage inflation is highly persistent, and impacts the economy broadly, this means in order to get overall inflation back down to 2% the Fed must tighten monetary policy much more than what consensus is looking for in order to increase the unemployment rate materially from the current sticky 3.6% cycle low level. Meanwhile Eurozone core inflation again surprised to the upside rising to 4.0% in July from 3.7% the prior month leaving the ECB with limited flexibility to provide insurance against the European sovereign and Energy crises.
Still behind the curve. Fed Chair Powell at the press conference following Wednesday’s FOMC meeting stated that the Fed has raised its target for the Federal Funds rate to its neutral rate at 2.5%. In an interview with the press today long time academic economist and former Treasury Secretary Lawrence Summers said Powell’s statement was “analytically indefensible” given super-high inflation. We agree with the implications of Summers’ comments and believe the Fed continues to be way behind the curve, which sets the stage for the risk of dramatic monetary policy tightening, a meaningful recession and significant sell-off in risk assets – in contrast to the recent rally of hope.
Two steps forward and one step back. The FOMC hiked 75bps as the economy appears strong given a super-tight labor market, although acknowledging some indicators of spending and production have softened. The Fed also reiterated a strong commitment to bringing inflation back down to 2%. Stating that future rate hikes can be large but are data dependent, and will tend to decline over time, Fed Chair Powell seemed to validate the tremendous loosening of financial conditions taken place since the prior meeting (June 15), leading to a rally in risk assets during the presser. Specifically interest rates have declined materially, stocks rallied and credit spreads tightened on the notion we are already close to a shallow and short lived recession and the Fed’s pivot, while corporate balance sheets remain strong and there is little credit risk. This undermines the Feds mission to tighten financial conditions and fight inflation.
Currency headwinds. US-based multinational companies with outsized exposure to the global economy have been caught in the crosshairs of significant US dollar strength this year. More than half of US IG companies have posted 2Q22 earnings results to date. What is clear from these results is that companies with overseas sales have posted the largest surprises relative to consensus expectations to both the upside and downside. In aggregate, median revenue and EPS beat of all IG companies is 1.1% and 4.5%, respectively. For companies with more than half of foreign sales, the median beat is 2.3% for the top-line and 6.7% for the bottom-line.”
CONCLUSION
The economic picture is very muddy. We have been strategically short of our midpoint duration targets, worried about inflation and the economic recovery. Our conviction in that strategy is not as firm as it was when we instituted these positions. Therefore, in the coming months, we anticipate extending these durations somewhat.
August is typically a terrible time to buy municipal bonds (they are seasonally expensive) so unless we see an increase in new issue supply, most of this extension will take place after Labor Day when vacation season is behind us. Additionally, we will likely be using taxable money funds in those accounts with excess cash due to the richness of the short-term portion of the municipal market relative to its taxable equivalents.
.png?width=500&name=signature%20block%20(3).png)
IMPORTANT DISCLOSURES
The information and statistics contained in this report have been obtained from sources we believe to be reliable but cannot be guaranteed. Any projections, market outlooks or estimates presented herein are forward-looking statements and are based upon certain assumptions. Other events that were not taken into account may occur and may significantly affect the returns or performance of these investments. Any projections, outlooks or assumptions should not be construed to be indicative of the actual events which will occur. These projections, market outlooks or estimates are subject to change without notice.
Please remember that past performance may not be indicative of future results. Different types of investments involve varying degrees of risk, and there can be no assurance that the future performance of any specific investment, investment strategy, or product or any non-investment related content, made reference to directly or indirectly herein will be profitable, equal any corresponding indicated historical performance level(s), be suitable for your portfolio or individual situation, or prove successful. Due to various factors, including changing market conditions and/or applicable laws, the content may no longer be reflective of current opinions or positions.
All indexes are unmanaged, and you cannot invest directly in an index. Index returns do not include fees or expenses. Actual portfolio returns may vary due to the timing of portfolio inception and/or investor-imposed restrictions or guidelines. Actual investor portfolio returns would be reduced by any applicable investment advisory fees and other expenses incurred in the management of an advisory account.
You should not assume that any discussion or information contained herein serves as the receipt of, or as a substitute for, personalized investment advice from City Different Investments. To the extent that a reader has any questions regarding the applicability above to his/her individual situation or any specific issue discussed, he/she is encouraged to consult with the professional advisor of his/her choosing. City Different Investments is neither a law firm nor a certified public accounting firm and no portion of this content should be construed as legal or accounting advice.
A copy of City Different Investments' current written disclosure statement discussing our advisory services and fees is available for review upon request.
Unless otherwise noted, City Different Investments is the source of information presented herein.
A description of the indices mentioned herein are available upon request.