.png)

WEEK ENDING 8/5/2022
Highlights of the week:
- The July jobs report threw a monkey wrench (not to be confused with monkeypox) into the recession debate.
- Four Federal Reserve officials came out in favor of continued aggressive Fed action toward short-term interest rates.
- The Biden administration had a pretty good week.
- Nancy Pelosi angered China with her visit to Taiwan.
- A municipal market study in both The Wall Street Journal and Bloomberg gets the CDI “snark attack.” (See our municipal market section for the complete snarky breakdown.)
A CITY DIFFERENT TAKE
This was a busy week. (Yes, we know we said that last week.)
Talk of a recession was put on the back burner after the release of the July jobs report. 528,000 jobs were created in July, and June’s numbers were revised to reflect an additional 26,000 jobs created. As measured by Bloomberg estimates, the markets predicted an increase of just 250,000 new jobs (oops).
Furthermore, the unemployment rate dropped from 3.6% to 3.5%. Average hourly earnings increased at a rate of 5.2%, beating an expected increase of 4.9% (though still below most inflation measures), while the labor force participation rate held steady at 62.1%.
Most fixed income markets reacted with significantly higher rates, but the municipal market must not have seen the full employment report.
CHANGES IN RATES
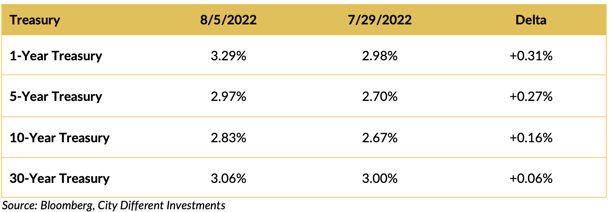
Rates in the Treasury market moved higher last week in reaction to the jobs report. The yield curve inverted from 1–30 years. The comments of four Fed officials lead one to believe that the Fed’s resolve to fight inflation remains intact and that more significant increases in short-term interest rates are on the way.
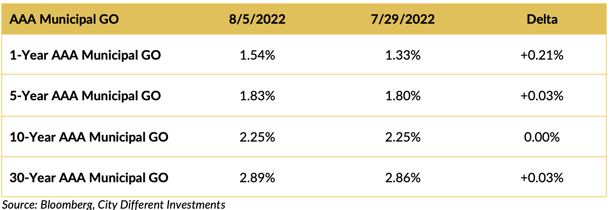
Rates in the municipal market barely moved last week, except in the one-year and shorter portion of the market. Municipal market participants must have missed the release of the July jobs report (rest assured that the CDI fixed income team did not). This could also be a reaction to extremely low seasonal supply. We expect new issuance supply to increase in September and provide municipal market participants a better entry point. That is, of course, unless muni dealers charge excessive markups.
A study of municipal market transaction costs was reviewed in The Wall Street Journal in an article titled “Muni Market Transaction Costs Remain High, Despite Customer Protection Rules, Study Says”.
An additional story can be found on Bloomberg. Having read both articles, our reaction is equal to Captain Renault's shock (see our LinkedIn post for full reference), summarized in the following bullet points:
- Muni dealers are in business; they are not a charity.
- Did the authors fail Latin and not hear of the phase “caveat emptor”?
- Are the authors not aware of all the work the Municipal Securities Rulemaking Board (MSRB) has done to improve transparency in the municipal market (price transparency included)?
To be fair, we have not read the study — just the above-referenced articles. (After reading those articles, however, we probably will not read the study.) Also, we are extremely biased, with Chris serving on the MSRB board for several years. The MSRB’s disclosure work can be found on the EMMA portion of their website, free to anyone with an internet connection.
If the general premise of the articles is correct, muni dealers charge the retail buyer of municipal bonds high transactional costs. Rest assured — the clients of City Different Investments benefit from our business model of cost-effective pricing for our services, a high degree of transparency, and our fixed income team’s experience.
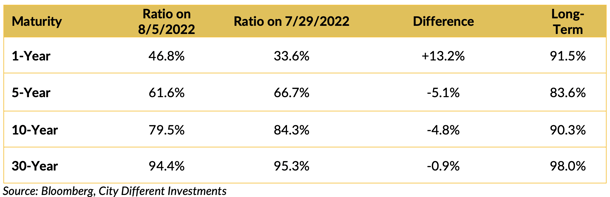
Muni-Treasury ratios decreased across the curve in the last week, except in the 1-year and shorter portion of the market. The municipal market’s front end looks unattractive compared to its Treasury equivalents. A higher M/T ratio tends to make Munis a more attractive buy.
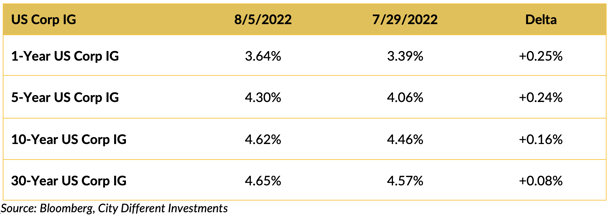
Investment-grade rates were mostly higher last week following the Treasury market’s lead.
THIS WEEK IN WASHINGTON

It was a busy week in Washington, as well.
The Inflation Reduction Act (IRA) was passed on Sunday, although a better name for the bill might be “Build Back Smaller.”
The chips bill was passed, although the Republicans got a little testy and delayed passage after getting outplayed by the Democrats.
The PACT Act was passed Tuesday night, expanding health care benefits for millions of veterans exposed to toxic burn pits. This bill also was the victim of pettiness. Last-minute changes were held up by outgoing Sen. Pat Toomey, causing proponents of the bill (including Jon Stewart, driving down from New Jersey) to protest outside the Capitol. Throughout our history, politicians support our soldiers when they are going off to war but neglect veterans when they come home. George Washington had an interesting perspective on veterans that should give us all food for thought:
"The willingness with which our young people are likely to serve in any war, no matter how justified, shall be directly proportional to how they perceive the veterans of earlier wars were treated and appreciated by their nation."
Nancy Pelosi stopped in Taiwan on her tour of Asia, prompting outrage from China. This caused a couple of talking heads on the financial cable channels to say things like, “don’t poke the bear” or we’re “pouring salt in an open wound for China.” Both sounded vaguely reminiscent of Neville Chamberlain’s “peace for our time.”
One final comment. We find it telling that the best examples of courage and character coming out of D.C. are set by women (not to overlook Adam Kinzinger). One from the Senate and Liz Cheney from the House. One Republican and one Democrat. Maybe Josh Hawley should examine this phenomenon before writing about “The Masculine Virtues America Needs.”
WHAT, ME WORRY ABOUT INFLATION?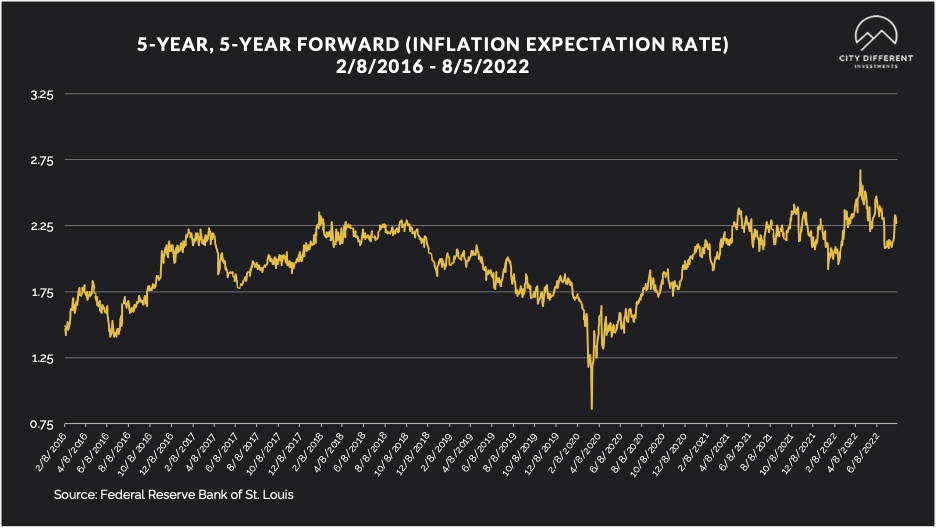
The 5-year Breakeven Inflation Rate ended the week at 2.28%, 5 basis points lower than last week’s closing 2.33%. The same can be said for the 10-year Breakeven Inflation Rate ending the week at 2.46%, 7 basis points lower than last week’s 2.53%.
MUNICIPAL CREDIT
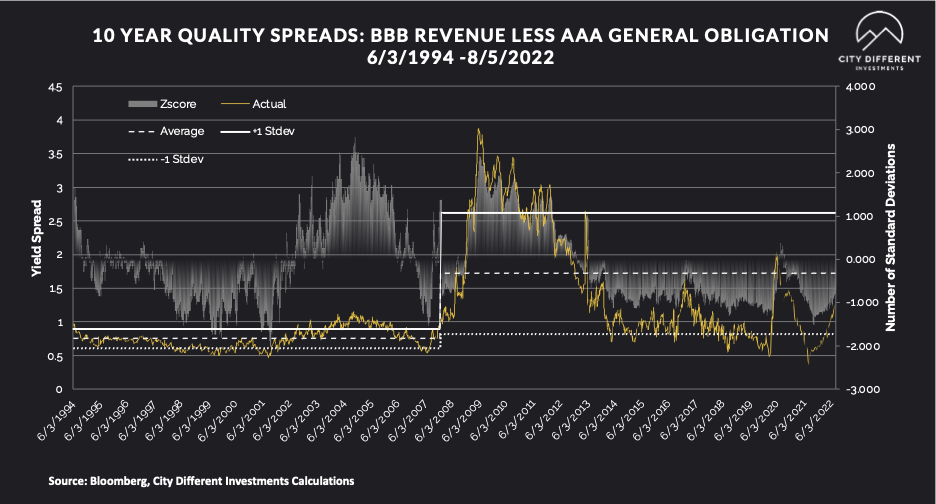
Quality spreads continued to widen, moving further into the fair range. While we don’t think the move has been significant enough to change our strategic outlook towards credit, it's getting close.
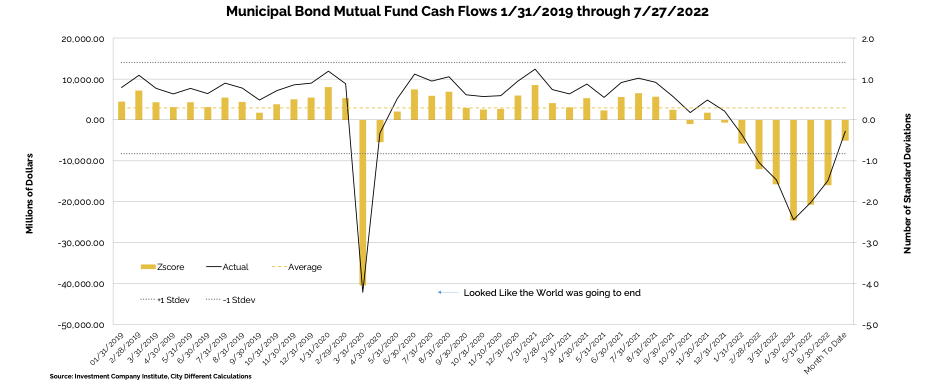
WHY IS THE MUNICIPAL MARKET BEHAVING THIS WAY?
Various sources are used to report cash flows related to municipal bond mutual funds and ETFs, all reporting at different times. The source we have chosen to use is the Investment Company Institute (I.C.I.). The I.C.I. reported weekly cash flows from municipal bond mutual funds for the week of July 27, as -$246 million compared to -$602 million from the week before.
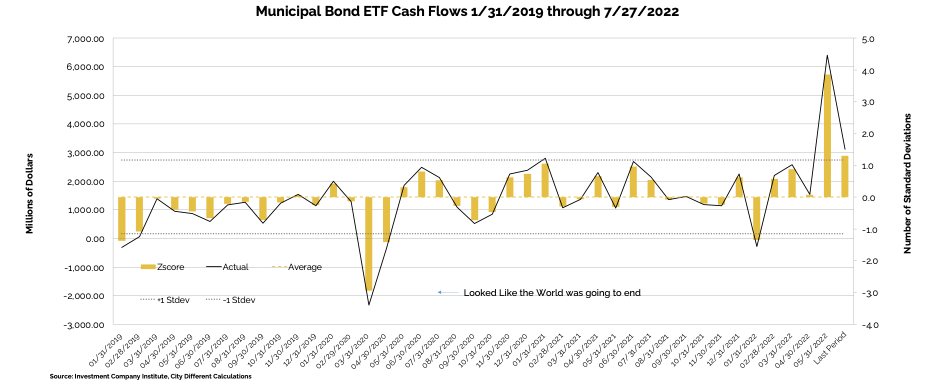
Municipal bond ETF cash flows for the same period were +$879 million, compared to -$23 million the prior week.
Other cash flow sources:
Lipper reported combined weekly and monthly inflows for the second straight week, with inflows of $1.6 billion for the period ending August 3 and decreasing YTD outflows to $79.1 billion. High Yield funds recorded $725 million of inflows, Intermediate funds saw $231 million of inflows, and Long Term funds saw $1.7 billion of inflows. Municipal ETFs registered $277 million of inflows.
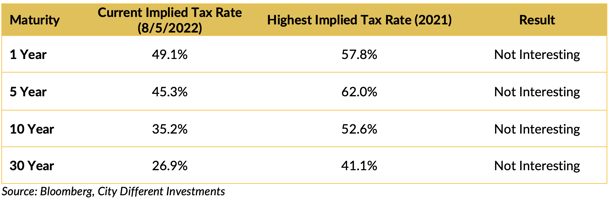
TAXABLE VS. TAX-EXEMPT MUNICIPAL BONDS
The implied tax rate for a taxable vs. a tax-exempt A.A. municipal bond in various maturities are as follows:
SUPPLY OF NEW ISSUE MUNICIPAL BONDS
In its Municipal Markets Weekly newsletter, JP Morgan commented on the supply picture this week, stating that:
“Next week we expect total supply of $6.2 billion, or 62% of the 5-year equivalent week average ($10.1 billion). We anticipate tax-exempt supply of $5.6 billion (71% of average), while taxable/corp cusip supply of just $0.6 billion (29% of the average) remains subdued.”
The supply picture does not get interesting until it exceeds $10 billion tax-exempt issuances in a given week.
CORPORATE INVESTMENT GRADE AND HIGH YIELD OVERVIEW
In U.S. Investment Grade land, new issue activity has petered out as the fixed income market digests the volatility.
In its weekly "Credit Flows" report, Wells Fargo commented:
- License to Hike. July’s jobs report shows the US economy moving in the exact opposite direction of what the Fed is trying to accomplish as nonfarm payrolls added 528,000 positions (vs. 250,000 expected), the unemployment rate declined to a new cycle low of 3.5% (vs. 3.6%), average hourly earnings rose 5.2% (4.9% consensus) and the labor participation rate slid to 62.1% (vs. 62.2%). These numbers are what you would expect to see if the US economy is overheating as opposed to the slowdown the Fed must engineer in order to combat super-high inflation.
- More wood to chop. The straightforward implication is that the Fed has much more work to do in terms of tightening financial conditions — they have to hike rates more than what is priced into the rates markets — possibly inter-meeting — and if long term interest rates do not rise materially sell MBS. As risk averse credit investors we would focus on the scenario this leads to a normal, deep or protracted recession. Remain bearish on corporate credit spreads.
- Default to wider credit spreads. We can’t make sense of HY currently at 428bps. The Federal Reserve’s Senior Loan Officer Survey for July showed a 25.7 percentage point increase in the net share of banks tightening lending standards for large and medium sized firms to 24.2%. That represents the third largest increase in history behind only two readings in the aftermath of Covid in 2020. Already - without the country being in recession yet - our macro model forecasts 6.18% defaults over the next twelve months, driven by tightening lending standards.
- Fair valuations in HY. Our model’s default rate implies a liquidity premium — difference between current spread and expected credit losses — of just 57bps, well below the historical average of 225bps as well as 232bps consistent with equity vol currently 21.25%. That argues for HY spreads right now of ~600bps (428bps+173bps). Moreover the historical average includes periods with Quantitative Easing and plentiful liquidity, whereas the next twelve months bring Quantitative Tightening (QT) and scarce liquidity. Hence arguably fair HY spreads in the present QT environment are ~670bps (our spread target is 800bps based on recession).
- To BBB Rather Than to BB. The snapback rally in credit fueled by hopes of a Fed pivot has resulted in significant recompression between BB and BBB spreads over the past month. After HY underperformed IG throughout 1H, the asset class has since gapped tighter on account of total return relief from declining UST yields and a strong imbalance between supply & demand. The relationship between BB and similar-duration BBB spreads has narrowed more than 100 bps from the YTD peak to 118 bps currently and is only 16 bps wider since the start of the year. BB valuations now hardly reflect the risks of aggressive Fed tightening and deteriorating economic backdrop, meaning the recent compression between BBs and BBBs is way overdone.
CONCLUSION
To quote Samuel L. Jackson in “Jurassic Park” — “hold on to your butts.”
August promises to be a volatile month. The strong July jobs report certainly didn’t resolve the question of whether the U.S. economy is in a recession. This week will see the release of two important inflation reports. Will they prove the four Fed officials talking about the Fed’s aggressive moves prescient or not?
See next week's commentary for the results.
.png?width=500&name=signature%20block%20(3).png)
IMPORTANT DISCLOSURES
The information and statistics contained in this report have been obtained from sources we believe to be reliable but cannot be guaranteed. Any projections, market outlooks or estimates presented herein are forward-looking statements and are based upon certain assumptions. Other events that were not taken into account may occur and may significantly affect the returns or performance of these investments. Any projections, outlooks or assumptions should not be construed to be indicative of the actual events which will occur. These projections, market outlooks or estimates are subject to change without notice.
Please remember that past performance may not be indicative of future results. Different types of investments involve varying degrees of risk, and there can be no assurance that the future performance of any specific investment, investment strategy, or product or any non-investment related content, made reference to directly or indirectly herein will be profitable, equal any corresponding indicated historical performance level(s), be suitable for your portfolio or individual situation, or prove successful. Due to various factors, including changing market conditions and/or applicable laws, the content may no longer be reflective of current opinions or positions.
All indexes are unmanaged, and you cannot invest directly in an index. Index returns do not include fees or expenses. Actual portfolio returns may vary due to the timing of portfolio inception and/or investor-imposed restrictions or guidelines. Actual investor portfolio returns would be reduced by any applicable investment advisory fees and other expenses incurred in the management of an advisory account.
You should not assume that any discussion or information contained herein serves as the receipt of, or as a substitute for, personalized investment advice from City Different Investments. To the extent that a reader has any questions regarding the applicability above to his/her individual situation or any specific issue discussed, he/she is encouraged to consult with the professional advisor of his/her choosing. City Different Investments is neither a law firm nor a certified public accounting firm and no portion of this content should be construed as legal or accounting advice.
A copy of City Different Investments' current written disclosure statement discussing our advisory services and fees is available for review upon request.
Unless otherwise noted, City Different Investments is the source of information presented herein.
A description of the indices mentioned herein are available upon request.