.png)

WEEK ENDING 8/26/2022
Highlights of the week:
-
The Federal Reserve’s Volcker-like message in Jackson Hole dominates the market.
-
Net shorts for US Treasury 2-years, 5-years at highest levels reflecting further rate hikes.
-
Inflation numbers soften, but the Fed’s resolve does not. Personal Consumption Expenditure (PCE) falls slightly for the first since April 2020.
A CITY DIFFERENT TAKE
We wonder if Federal Reserve Chairman Jerome Powell was invoking the spirit of Paul Volcker when he said:
“Restoring price stability will take some time and requires using our tools forcefully to bring demand and supply into better balance. Reducing inflation is likely to require a sustained period of below-trend growth. Moreover, there will very likely be some softening of labor market conditions. While higher interest rates, slower growth, and softer labor market conditions will bring down inflation, they will also bring some pain to households and businesses. These are the unfortunate costs of reducing inflation. But a failure to restore price stability would mean far greater pain.”
Or was he invoking the spirit of Rocky’s nemesis Clubber Lang from “Rocky III”?
Interviewer:
What's your prediction for the fight?
Clubber Lang:
My prediction?
Interviewer:
Yes, your prediction.
Clubber Lang:
Pain!
Either way, Powell’s comments signal higher rates and pain to come for both the market and consumers alike. The Chicago Mercantile Exchange is showing a 68% probability of a 75bps rate hike for September. The peak federal funds rate is expected to be around 3.75% to 4% by the end of the year.
This sentiment is very well documented in the U.S. Treasury 2-year futures; net shorts are the highest they’ve been in a year. As of the morning we’re writing this, the 2-Year Treasury Bill opened at 3.43%. The 5-year part of the curve is bearish as well. Net short positioning is at its highest point since November 2018.
PCE, one of the most-watched inflation indicators, fell by 0.1% in July. This marginal decrease is notable because this is its first decline since April 2020. The biggest component of this decline is energy, down by 4.8% in July.
The consumer still feels the pain if they choose to eat, however, as food prices are topping off at a 1.3% increase. Annualize these numbers and you’re looking at a year-over-year PCE of 6.3% (versus 6.8% in June). Similarly, core PCE inflation has come down to 4.6% year over year in July (versus 5.4% in June).
Decline in energy should help calm inflation. But labor cost and rents are still at an all-time high with no indication of lowering — and an aggressive Federal Reserve is not backing down from its mandate of taming inflation anytime soon. What’s still a question is whether we ever return to pre-pandemic levels.
CHANGES IN RATES
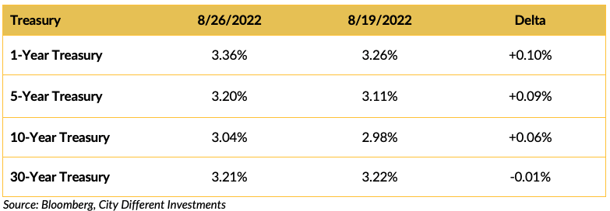
Interest rates in the Treasury market moved higher last week. The slope of the yield curve is inverted 1 to 30 years. Chairman Powell’s Jackson Hole speech did cause some pain on Friday.
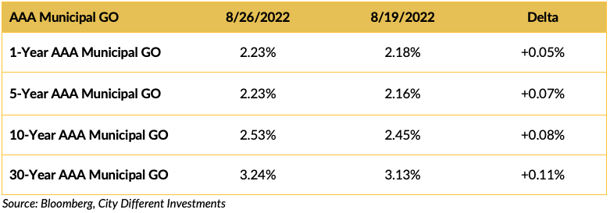
Municipal interest rates moved higher last week, especially in the short end of the market.
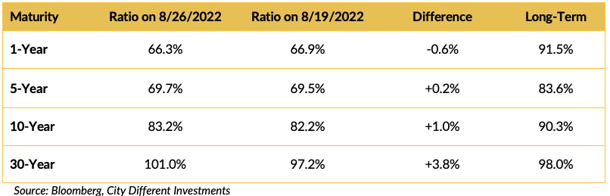
Muni-Treasury ratios were higher last week. A result of market participants revaluing the municipal market. A higher M/T ratio tends to make Munis a more attractive buy.
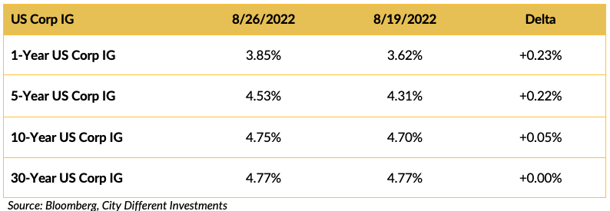
Investment-grade rates were higher last week following the Treasury market’s lead.
THIS WEEK IN WASHINGTON

Student debt relief is the biggest news to come out of Washington this week.
President Biden’s debt relief program forgives up to $20,000 in federal loans for some students. The president has announced a four-month extension of the mortarium on loan repayments. In addition, undergraduate loan repayment minimums will be capped at 5% of the borrower’s monthly income.
In other news, the U.S. Navy sent two guided-missile cruisers through the Taiwan Strait for a “routine” trip. This maneuver comes on the heels of U.S. House Speaker Nancy Pelosi’s visit to Taiwan. In a response to the naval presence, China accused the U.S. of destroying peace.
WHAT, ME WORRY ABOUT INFLATION?
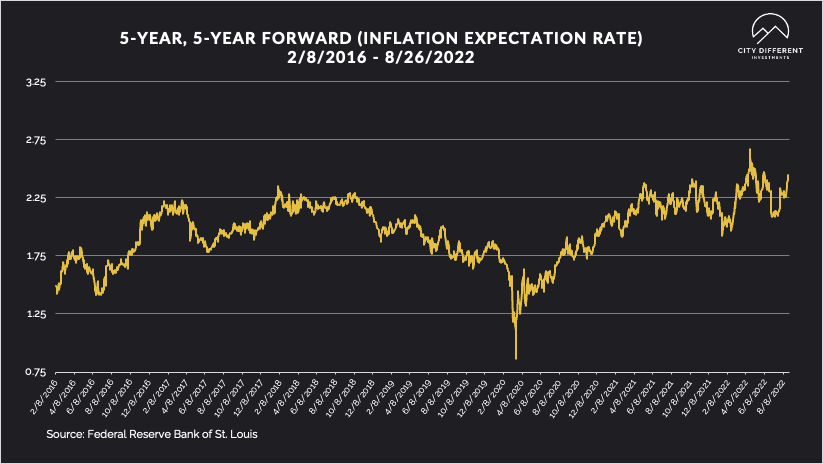
The 5-year Breakeven Inflation Rate ended the week at 2.41%, 3 basis points higher than last week’s closing 2.38%. The same can be said for the 10-year Breakeven Inflation Rate ending the week at 2.57%, 2 basis points higher than last week’s 2.55%.
MUNICIPAL CREDIT
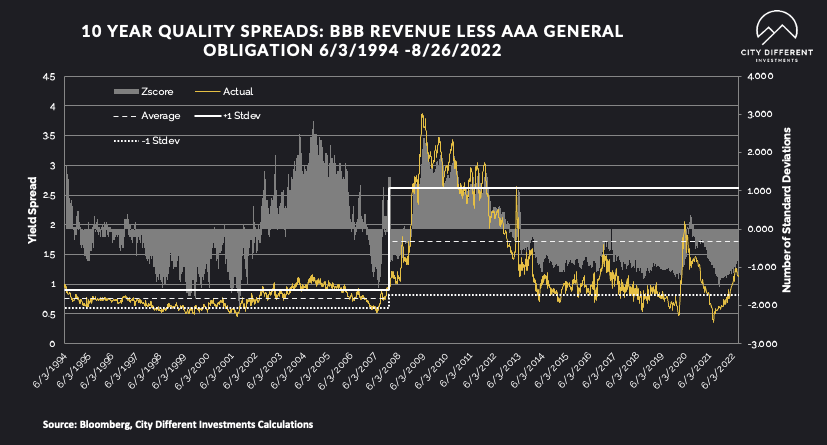
Quality spreads continued to widen, moving further into the fair range, starting to pique our interest. While we don’t think the move has been significant enough to change our strategic outlook towards credit, it's getting close.
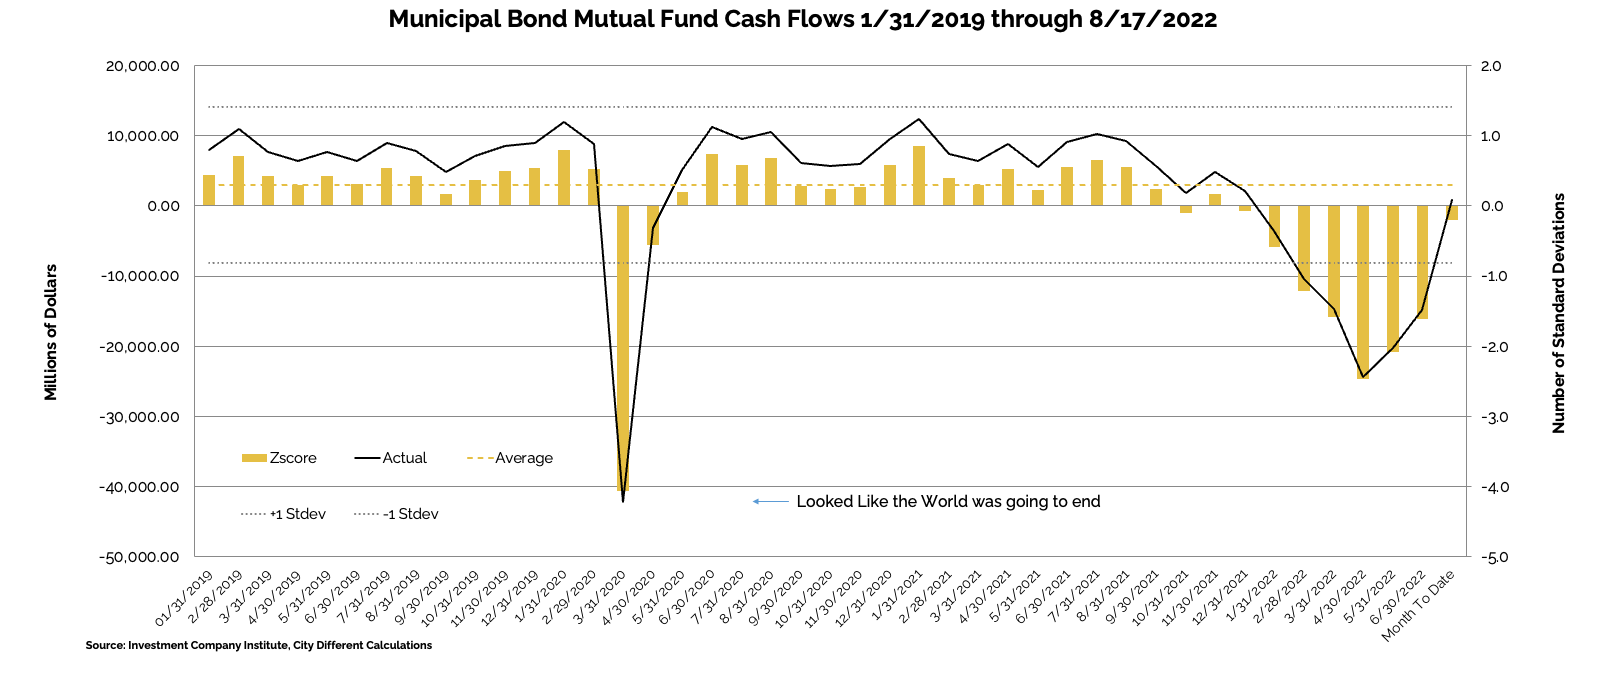
WHY IS THE MUNICIPAL MARKET BEHAVING THIS WAY?
Various sources are used to report cash flows related to municipal bond mutual funds and ETFs, all reporting at different times. The source we have chosen to use is the Investment Company Institute (I.C.I.). The I.C.I. reported weekly cash flows from municipal bond mutual funds for the week of August 17, as +$320 million compared to +$223 million from the week before.
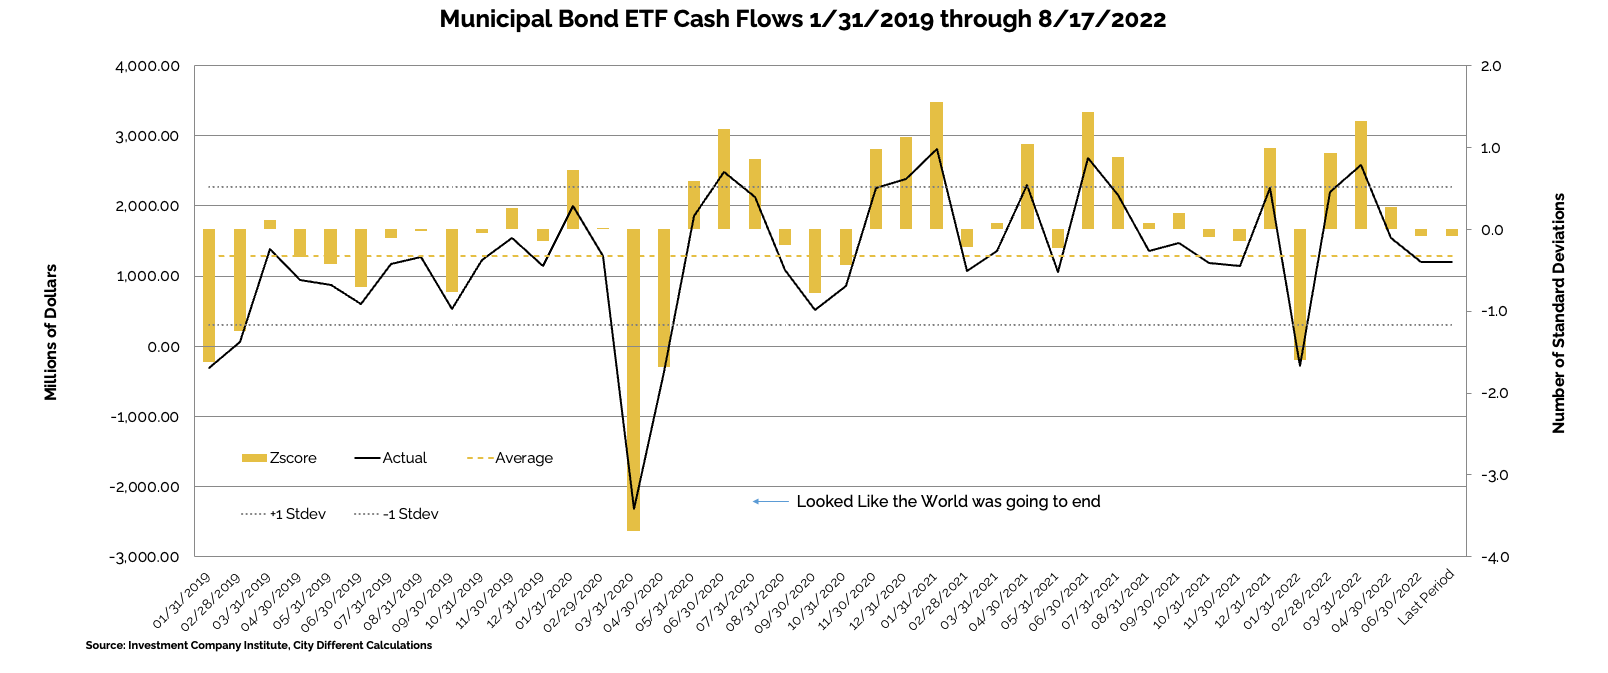
Municipal bond ETF cash flows for the same period were -$200 million, compared to -$379 million the prior week.
Other cash flow sources:
In its Municipal Morning Intelligence newsletter from August 26th, J.P. Morgan commented:
“Lipper reported a third combined weekly and monthly outflow, with $1.2 billion leaving Muni funds for the period ending August 24, increasing YTD outflows to $81.2 billion. High Yield funds recorded $167 million of outflows, while Intermediate funds saw $39 million of inflows, and Long Term funds saw $1.0 billion of outflows. Municipal ETFs registered $472 million of outflows. Weekly reporting funds were responsible for all of the flows this period.”
SUPPLY OF NEW ISSUE MUNICIPAL BONDS
In its Municipal Markets Weekly newsletter, JP Morgan commented on the supply picture this week, stating that:
“Next week’s calendar of $6.1 billion (83% of the equivalent week 5-year average of $7.3 billion), is mostly skewed towards tax-exempts, with tax-exempt supply of $5.4 billion (99% of the average), and taxable/corp cusip supply of $0.7 billion (38% of the average).”
The supply picture does not get interesting until it exceeds $10 billion tax-exempt issuances in a given week.
CORPORATE INVESTMENT GRADE AND HIGH YIELD OVERVIEW
In U.S. Investment Grade land, new issue activity has petered out as the fixed income market digests the volatility.
In its weekly "Credit Flows" report, Wells Fargo commented:
“Powell’s Volcker moment. At the Jackson Hole Economic Symposium Fed Chair Powell finally changed identity from Arthur Burns to Paul Volker. Make no mistake he was trying to send a very clear message. Specifically we quote: 1) “The FOMC’s overarching focus right now is to bring inflation back down to our 2 percent goal”, 2) “Restoring price stability will take some time”, 3) “There will very likely be some softening of labor market conditions”, 4) “Reducing inflation is likely to require a sustained period of below-trend growth”. This is probably as close as we get to Volcker’s stated intent more than forty years ago to push the US economy into recession. Now that the genie is out of the bottle we think 75bps at the next meeting along with coming off hawkish from the presser for a change. Hence stocks down 3%+ today.
Lagarde’s Volcker moment? While a ECB President Lagarde Volcker moment appears less likely — we would not entirely dismiss today’s press report that some officials want to discuss a 75bps hike at the next (September 8) meeting. Because they think about inflation more in terms of headline than core inflation, arguably the ECB is faring even worse than the Fed in terms of meeting their objective. Today’s price action in the European rates market added 8bps bringing the expected rate hike to 63bps at the next ECB meeting while 2-year bund yields rose 11bps to 0.99%. Then after the close ECB’s Holzmann (Austria, hawk) said 75bps should be on the table in Sep. and news headlines stated some ECB officials want QT talks in 2022. Between the Fed and ECB it seems the path for global rates is skewed decisively to the upside.
The four stages of grief. 2022 in four stages. 1) Higher interest rates and lower stocks (wider spreads) on monetary policy tightening and increasing recession risk until mid-June. 2) Lower interest rates and higher stocks in a partial reversal of moves from the first part of the year as some felt recession was imminent. 3) Starting in August both higher rates and stocks on higher probability of a soft landing. 4) Now we are solidly in the fourth stage until at least the end of year — which is similar to stage one — with higher interest rates and lower stocks (wider spreads), given strong economic/inflation data and the hawkish shift among central banks.
Asia USD vs US IG credit. We think Asia (ex Japan) USD IG credit spreads are a bit rich here just 10bps (7%) behind the US IG corporate bond market compared to 20bps and 18% on average historically — usually a pretty tight relationship. Given elevated China risks, the outlook for higher interest rates and a stronger dollar we are underweight Asia IG. On an absolute basis we expect credit spreads to widen globally.
Data section: We show quality spreads from A-AA rated all the way through CCC-B for US and EUR corporate bonds. Also show relative value between USD vs EUR and US vs Asia credit.”
CONCLUSION
Chairman Powell dug his heels into Jackson Hole, warning of higher rates and sharper “pain.” Treasury yields reflecting higher highs complement the dipping stock indices. Finally, slowing inflation numbers are met with a hawkish Federal Reserve.
.png?width=500&name=signature%20block%20(3).png)
IMPORTANT DISCLOSURES
The information and statistics contained in this report have been obtained from sources we believe to be reliable but cannot be guaranteed. Any projections, market outlooks or estimates presented herein are forward-looking statements and are based upon certain assumptions. Other events that were not taken into account may occur and may significantly affect the returns or performance of these investments. Any projections, outlooks or assumptions should not be construed to be indicative of the actual events which will occur. These projections, market outlooks or estimates are subject to change without notice.
Please remember that past performance may not be indicative of future results. Different types of investments involve varying degrees of risk, and there can be no assurance that the future performance of any specific investment, investment strategy, or product or any non-investment related content, made reference to directly or indirectly herein will be profitable, equal any corresponding indicated historical performance level(s), be suitable for your portfolio or individual situation, or prove successful. Due to various factors, including changing market conditions and/or applicable laws, the content may no longer be reflective of current opinions or positions.
All indexes are unmanaged, and you cannot invest directly in an index. Index returns do not include fees or expenses. Actual portfolio returns may vary due to the timing of portfolio inception and/or investor-imposed restrictions or guidelines. Actual investor portfolio returns would be reduced by any applicable investment advisory fees and other expenses incurred in the management of an advisory account.
You should not assume that any discussion or information contained herein serves as the receipt of, or as a substitute for, personalized investment advice from City Different Investments. To the extent that a reader has any questions regarding the applicability above to his/her individual situation or any specific issue discussed, he/she is encouraged to consult with the professional advisor of his/her choosing. City Different Investments is neither a law firm nor a certified public accounting firm and no portion of this content should be construed as legal or accounting advice.
A copy of City Different Investments' current written disclosure statement discussing our advisory services and fees is available for review upon request.
Unless otherwise noted, City Different Investments is the source of information presented herein.
A description of the indices mentioned herein are available upon request.