.png)

WEEK ENDING 8/19/2022
Highlights of the week:
- Impact of Quantitative Tightening by the Federal Reserve – it’s complicated.
- Jackson Hole to determine the fate of the markets.
- Oil futures differ from the reality of increased oil production.
A CITY DIFFERENT TAKE
Quantitative tightening, or the Federal Reserve shrinking its $9 trillion balance sheet as of June 2022, is a complicated process. First-level thinking says this would cool down the stock and bond market euphoria. Fed watchers concluded the shrinking of the balance sheet would lead to new issuance from the Treasury. However, the plot twist was in the form of healthy tax revenue and lower pandemic spending. The net result is that the Federal government does not need to borrow as much from the Treasury market. (Currently, the federal government borrows by creating a net notes, bills and bond issuance). However, the market response to QT isn’t static, it changes to meet Fed actions.
Layered in this complication is also, the bet that the slowing economy will force the Federal Reserve to stop raising rates. All eyes this week are watching the Friday’s Federal Reserve gathering in Jackson Hole. More market participants are betting on a 50 bps rate increase versus a 75bs rate increase. Although, the equity market sell off last Friday and this morning shows a softening Federal reserve is not a forgone conclusion.
Like everything else in life, the reality versus perception for oil is mismatched as well. At least, that is what the Saudi Prince and Energy Minister Abdulaziz bin Salaman seem to think. Saudi Arabia represents the largest oil producer of OPEC+ (23 nation alliance). The sharp drop in oil prices from $120 a barrel in June to $93 in early August is a reflection of a slow down in global economies and the possibility of more Iranian oil. The current reality is that OPEC+ has steadily increased the pace of production given the Russia-Ukraine volatility. Iranian oil supply could be boosted given a revived nuclear deal.
CHANGES IN RATES
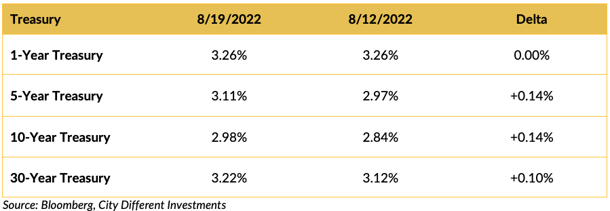
Interest rates in the Treasury market moved higher last week. The slope of the yield curve is very flat 1-30 years but inverted in shorter segments.
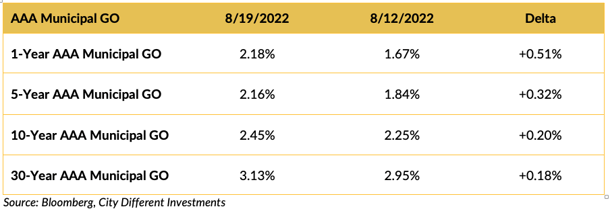
Interest rates moved higher last week, especially in the short end of the market. September issuance is looming, and market participants appear to be revaluing the municipal market in anticipation of higher yields in the fall.
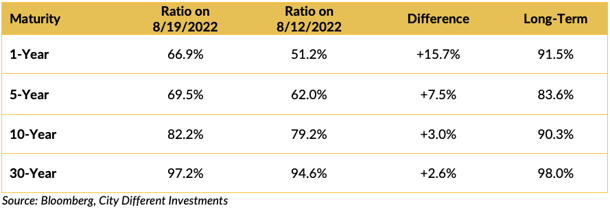
Muni-Treasury ratios were higher last week. A result of market participants revaluing the municipal market. A higher M/T ratio tends to make Munis a more attractive buy.
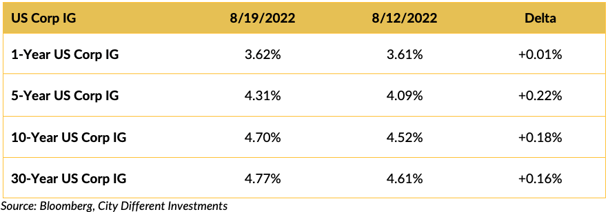
Investment-grade rates were higher last week following the Treasury market’s lead.
THIS WEEK IN WASHINGTON

President Biden spoke to the German, French, and UK leaders to respond to Iran’s nuclear proposal. Last week Iran responded to the EU’s framework for a revived Iranian accord. This has far-reaching implications on the world’s oil market. The return of Iranian crude could replace Russian oil, as the world deals with Russian uncertainty.
In other news, Indonesia is hosting this year’s G-20, and both Putin and Xi Jiping are planning to attend. This will be an odd summit for the group of 20, given the ongoing Russia and Ukraine conflict. Back at home, the president launches his midterm campaign this week.
WHAT, ME WORRY ABOUT INFLATION?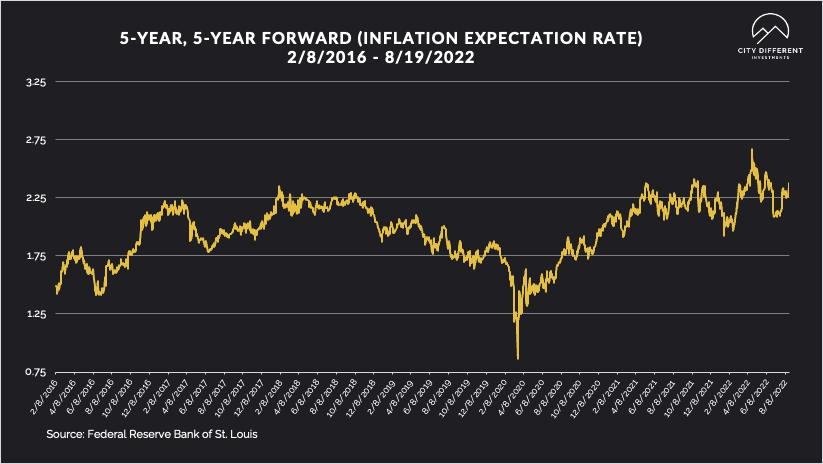
The 5-year Breakeven Inflation Rate ended the week at 2.38%, 11 basis points higher than last week’s closing 2.27%. The same can be said for the 10-year Breakeven Inflation Rate ending the week at 2.55%, 8 basis points higher than last week’s 2.47%.
MUNICIPAL CREDIT
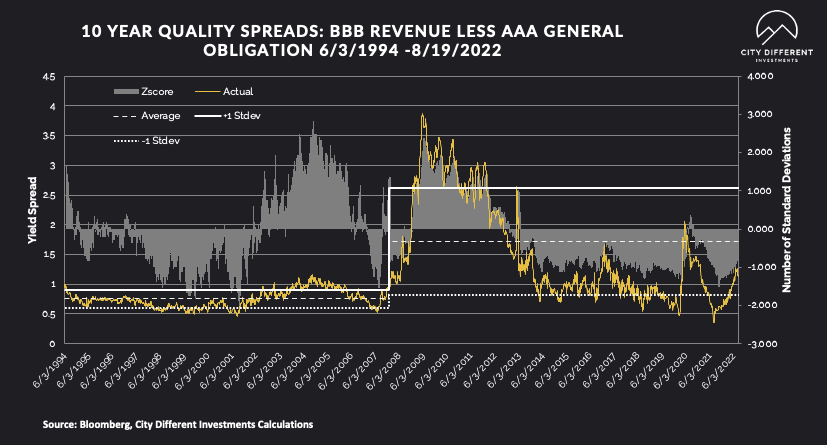
Quality spreads continued to widen, moving further into the fair range, and are starting to pique our interest. While we don’t think the move has been significant enough to change our strategic outlook towards credit, it's getting close.
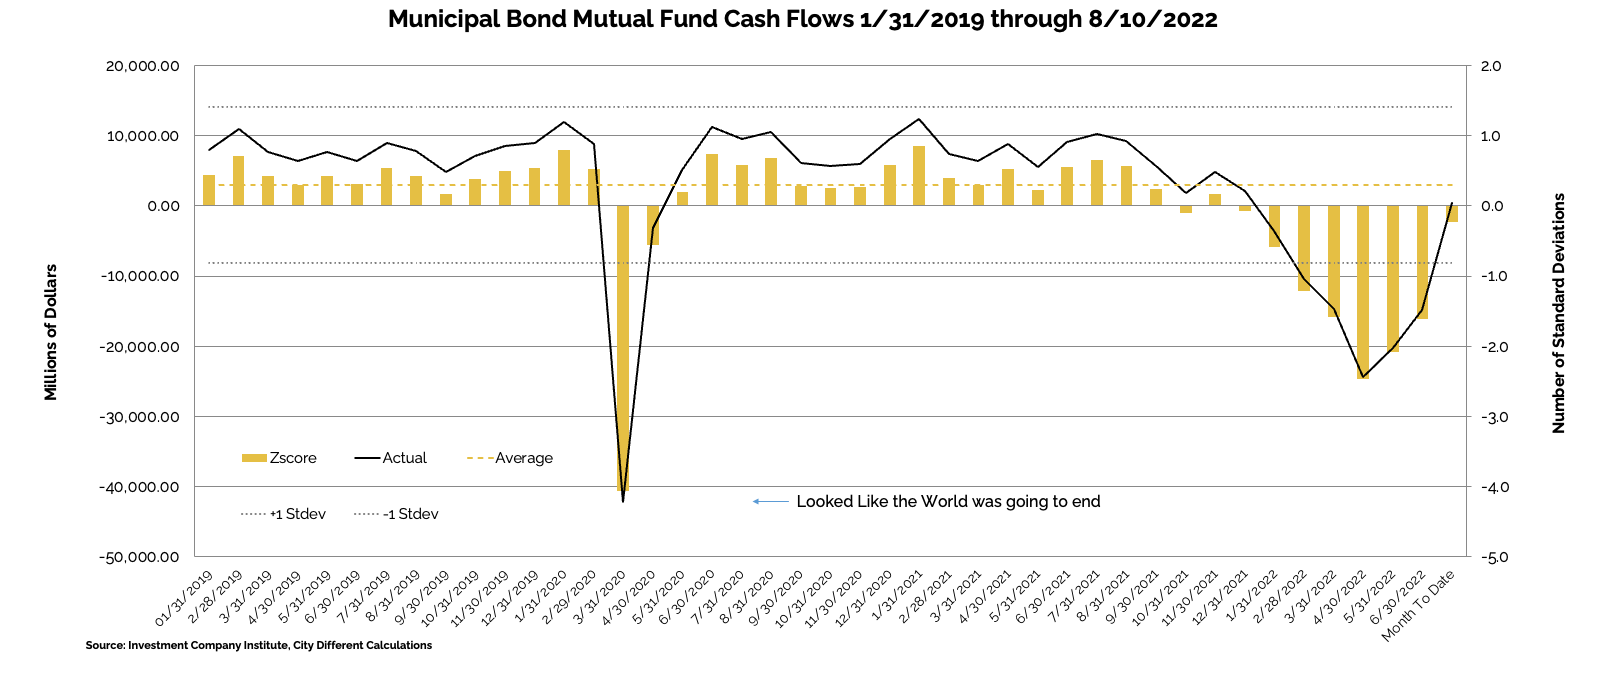
WHY IS THE MUNICIPAL MARKET BEHAVING THIS WAY?
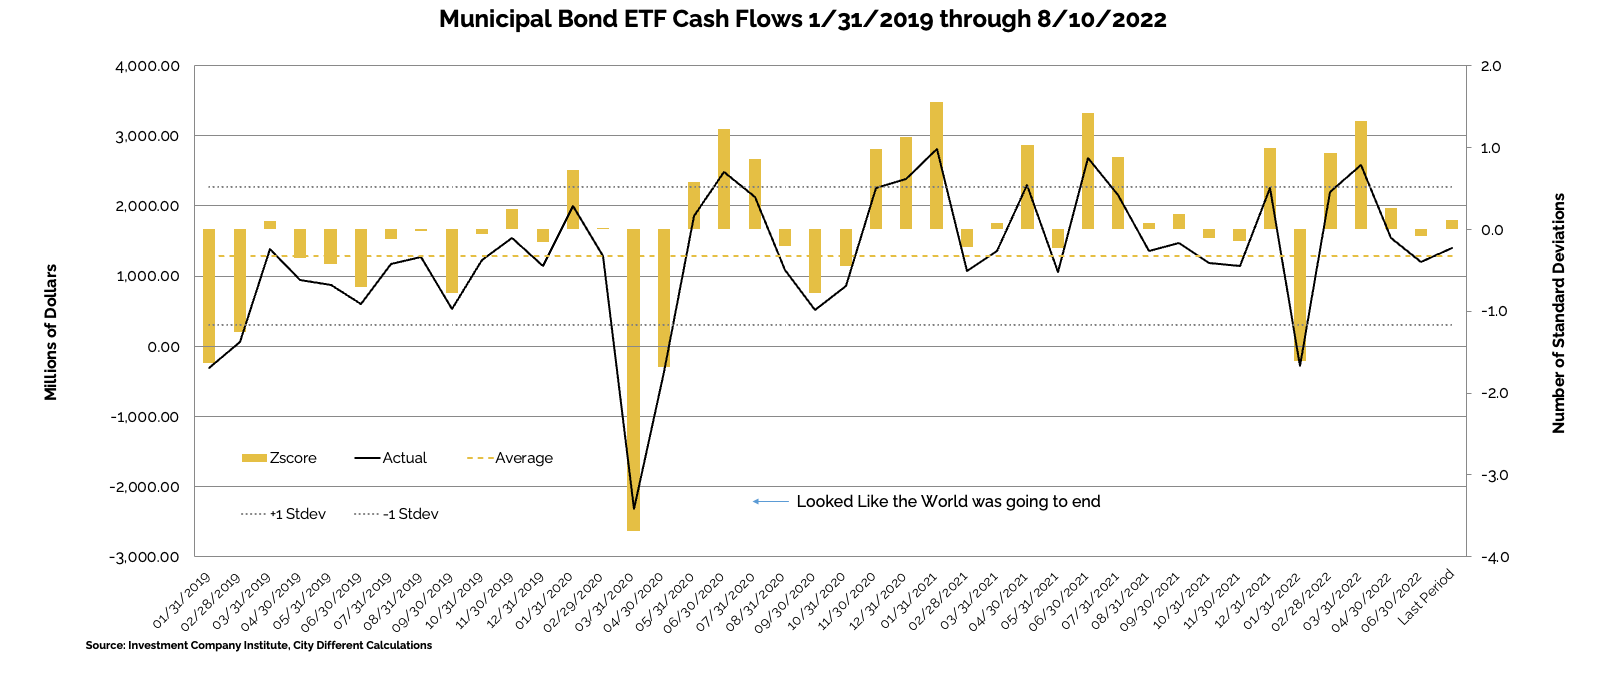
Various sources are used to report cash flows related to municipal bond mutual funds and ETFs, all reporting at different times. The source we have chosen to use is the Investment Company Institute (I.C.I.). The I.C.I. reported weekly cash flows from municipal bond mutual funds for the week of August 10, as +$223 million compared to +$1.6 billion from the week before.
Municipal bond ETF cash flows for the same period were -$379 million, compared to +$352 million the prior week.
Other cash flow sources:
J.P. Morgan reported 08/18 Estimated Daily Fund Flows: All Muni -$58mn, High Yield Muni $29mn, Long Term Muni -$58mn, Muni ETF $3mn. Cumulative fund flows since last Wed (08/17) estimated: all muni -$58mn, HY muni $29mn, and Long-Term muni -$58mn.
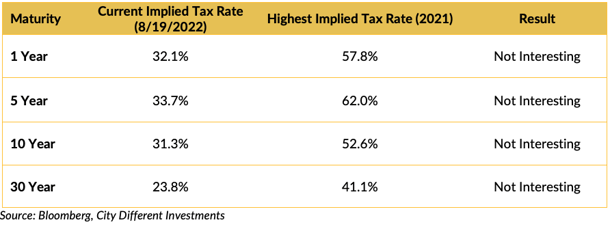
TAXABLE VS. TAX-EXEMPT MUNICIPAL BONDS
The implied tax rate for a taxable vs. a tax-exempt A.A. municipal bond in various maturities are as follows:
SUPPLY OF NEW ISSUE MUNICIPAL BONDS
In its Municipal Markets Weekly newsletter, JP Morgan commented on the supply picture this week, stating that:
“Next week’s calendar of $6.5bn (86% of the 5yr avg of $7.5bn), is mostly skewed towards tax-exempts, with tax-exempt supply of $6.0bn (101% of the avg), and taxable/corp cusip supply of just $0.5bn (29% of the avg). After this week’s scale adjustments, the market should digest primary offerings relatively well. That said, headwinds including outflows over the past two weeks, light summer attendance, and weaker technicals in Sept/Oct remain a challenge for the market.”
The supply picture does not get interesting until it exceeds $10 billion tax-exempt issuances in a given week.
CORPORATE INVESTMENT GRADE AND HIGH YIELD OVERVIEW
In U.S. Investment Grade land, new issue activity has petered out as the fixed income market digests the volatility.
In its weekly "Credit Flows" report, Wells Fargo commented:
“Hawk Days of Summer. While traditionally this time of the year investors are on summer vacations and market moving news flow is light, this time marks a crucial inflection point in an unprecedented cycle of global monetary policy tightening. First financial conditions in the US have loosened tremendously over the past two months, which is the opposite of what is needed to get inflation - especially wages - under control. Hence the importance of the Jackson Hole Economic Symposium by the end of next week where Fed Chair Powell is scheduled to speak Friday 10am EDT. We think he needs to send a clear hawkish message.
Inflation, oh dear. Meanwhile UK CPI inflation for July came out in double digits (10.1%) and is projected to increase further, setting up the Bank of England for aggressive tightening as well. Also this week ECB Executive Board Member Schnabel made it clear the central bank so far has made little progress in fighting inflation in the Eurozone – in fact numbers could increase further - and promising significant monetary policy tightening going forward. Then overnight another outsized German inflation beat with PPI for July surging further from 32.7% to 37.2%. Now granted a lot of that is likely from non-core sources like Energy – but remember the ECB favors to view their inflation target in the context of headline as opposed to core inflation
Ciao BTP. With Europe looking set to further tighten financial conditions we are seeing wider credit spreads there including notably for Italian sovereign spreads, as higher than expected inflation may be the excuse investors were waiting for before testing the ECBs resolve to cap the extent of tightening financial conditions for the periphery. Furthermore, higher than expected inflation in Europe is a global issue because, as we saw this week, upward pressure on European interest rates effectively un-anchors US interest rates via global investment flows, adding upward pressure without any change in the outlook for US inflation and the Fed.
Back to school. Accordingly, our shopping list for the new school year is as follows. We would buy protection on the indices globally on a wall of worries. In the US add short BB/long BBB trade on the outlook for recession, given tight relationship. Plan for the resumption of outflows, which in IG means prepare for renewed flattening pressure in the front end of the curve. Anticipate the European sovereign crisis to worsen by shorting as close to the Italian sovereign as possible, including peripheral banks. Short core European banks vs. US banks on the energy crisis and risk of depression in Europe coupled with thin capitalizations. Tactically long US leveraged loans vs HY bonds (but bearish both) on the Fed hiking substantially more than priced in the rates market and holding there for longer.”
CONCLUSION
- Quantitative tightening is still playing out, the results of which are not as black and white as predicted earlier this summer.
- The market is on wait-and-see mode, waiting on verbiage out of Jackson Hole.
- Oil production and oil futures are disconnected due to an added twist of Iranian oil supply.
.png?width=500&name=signature%20block%20(3).png)
IMPORTANT DISCLOSURES
The information and statistics contained in this report have been obtained from sources we believe to be reliable but cannot be guaranteed. Any projections, market outlooks or estimates presented herein are forward-looking statements and are based upon certain assumptions. Other events that were not taken into account may occur and may significantly affect the returns or performance of these investments. Any projections, outlooks or assumptions should not be construed to be indicative of the actual events which will occur. These projections, market outlooks or estimates are subject to change without notice.
Please remember that past performance may not be indicative of future results. Different types of investments involve varying degrees of risk, and there can be no assurance that the future performance of any specific investment, investment strategy, or product or any non-investment related content, made reference to directly or indirectly herein will be profitable, equal any corresponding indicated historical performance level(s), be suitable for your portfolio or individual situation, or prove successful. Due to various factors, including changing market conditions and/or applicable laws, the content may no longer be reflective of current opinions or positions.
All indexes are unmanaged, and you cannot invest directly in an index. Index returns do not include fees or expenses. Actual portfolio returns may vary due to the timing of portfolio inception and/or investor-imposed restrictions or guidelines. Actual investor portfolio returns would be reduced by any applicable investment advisory fees and other expenses incurred in the management of an advisory account.
You should not assume that any discussion or information contained herein serves as the receipt of, or as a substitute for, personalized investment advice from City Different Investments. To the extent that a reader has any questions regarding the applicability above to his/her individual situation or any specific issue discussed, he/she is encouraged to consult with the professional advisor of his/her choosing. City Different Investments is neither a law firm nor a certified public accounting firm and no portion of this content should be construed as legal or accounting advice.
A copy of City Different Investments' current written disclosure statement discussing our advisory services and fees is available for review upon request.
Unless otherwise noted, City Different Investments is the source of information presented herein.
A description of the indices mentioned herein are available upon request.