.png)

WEEK ENDING 8/12/2022
Highlights of the week:
- Overall, a quiet week in the fixed income markets.
- Inflation releases were below estimates.
- Federal Reserve officials continue to sing a hawkish tune.
A CITY DIFFERENT TAKE
The fixed income markets were relatively quiet, week-over-week. The latest inflation readings were released and both headline CPI and PPI month-over-month numbers were below expectations. The core readiness of each series was also below expectations.
Multiple Bloomberg articles featured statements from several Fed officials continuing to beat the rate-hike drum. The president of the Federal Reserve Bank in Minneapolis and interest rate dove-turned-hawk, Neel Kashkari, indicated he wants the Fed Funds rate at 3.9% by year end, and at 4.4% by the end of 2023. The president of the Chicago Fed, Charles Evans, also indicated the Fed will tighten into next year to curb inflation. The implied breakeven inflation rates (the market's forecast of future inflation) barely moved last week.
CHANGES IN RATES
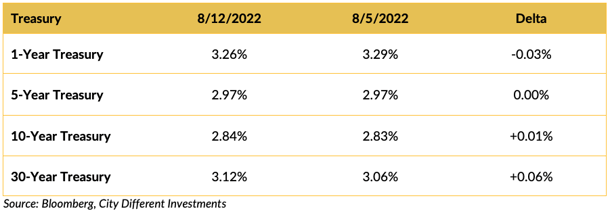
Week to week, the Treasury market was very quiet. We saw little change in rates while the curve remains inverted.
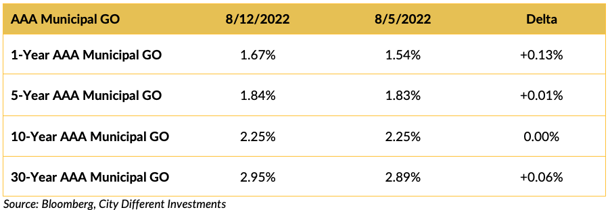
Last week’s analysis of the municipal market can be repeated this week. “Rates in the municipal market barely moved last week, except in the one-year and shorter portion of the market”. Seasonally low new-issuance levels are no doubt influenced by the dog days of summer and market participants on vacation.
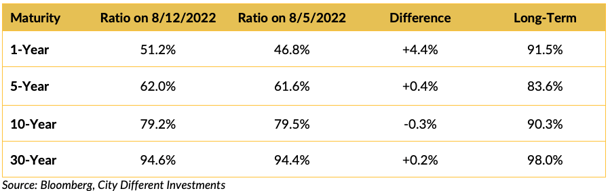
Muni-Treasury ratios were essentially unchanged in maturities longer than one year. The 1-year and shorter portion of the market moved higher from historically rich levels. The municipal market's front end still looks unattractive compared to its Treasury equivalents. A higher M/T ratio tends to make Munis a more attractive buy.
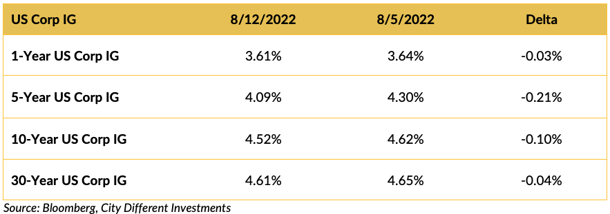
Investment-grade rates were mostly unchanged last week following the Treasury market’s lead.
THIS WEEK IN WASHINGTON

The Biden administration was poised to take a victory lap after last week’s legislative wins — only to be “trumped” in the news by the FBI executing a search warrant at the former president’s Mar-a-Lago estate. (Please excuse the easy, intentional, and hackneyed pun.)
WHAT, ME WORRY ABOUT INFLATION?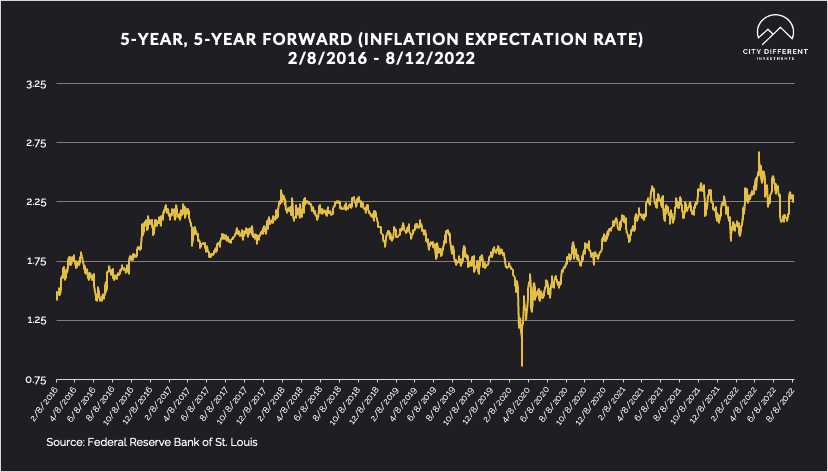
The 5-year Breakeven Inflation Rate ended the week at 2.27%, 1 basis point lower than last week’s closing 2.28%. The same can be said for the 10-year Breakeven Inflation Rate ending the week at 2.47%, a basis point higher than last week’s 2.46%.
MUNICIPAL CREDIT
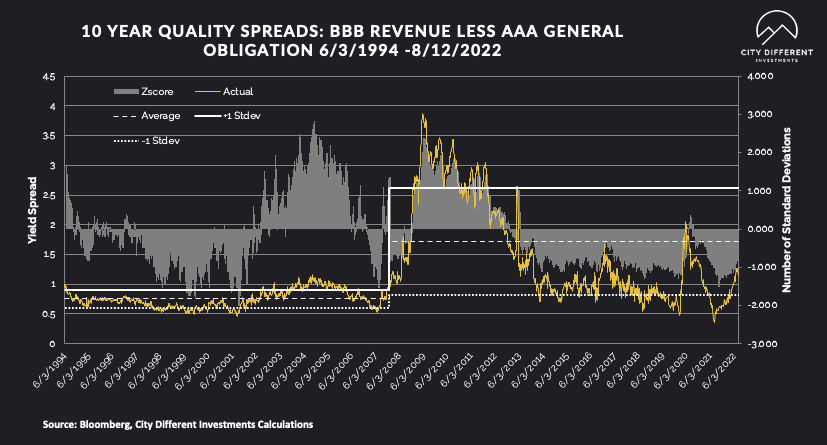
Quality spreads continued to widen, moving further into the fair range, and are starting to pique our interest. While we don’t think the move has been significant enough to change our strategic outlook towards credit, it's getting close.
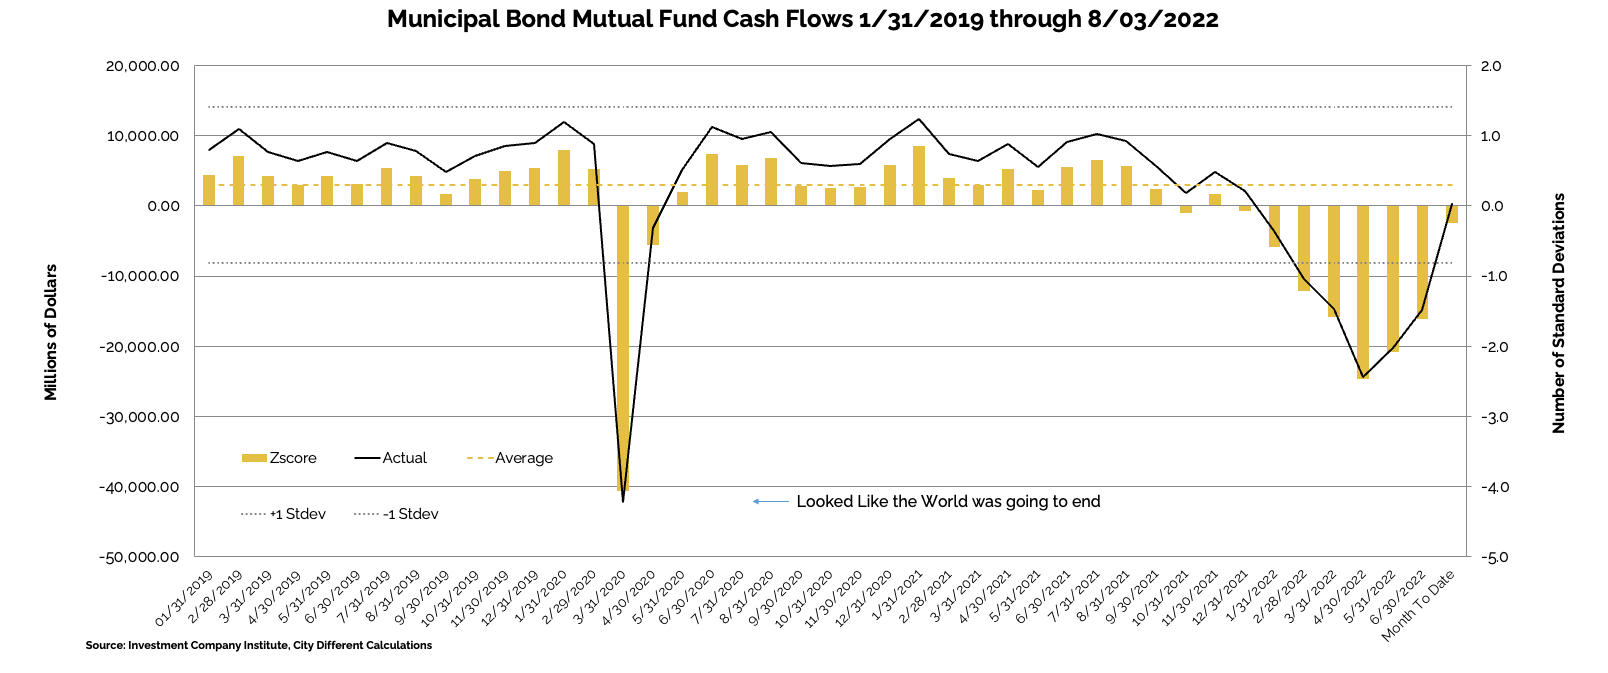
WHY IS THE MUNICIPAL MARKET BEHAVING THIS WAY?
Various sources are used to report cash flows related to municipal bond mutual funds and ETFs, all reporting at different times. The source we have chosen to use is the Investment Company Institute (I.C.I.). The I.C.I. reported weekly cash flows from municipal bond mutual funds for the week of August 3, as +$1.60 billion compared to -$246 million from the week before.
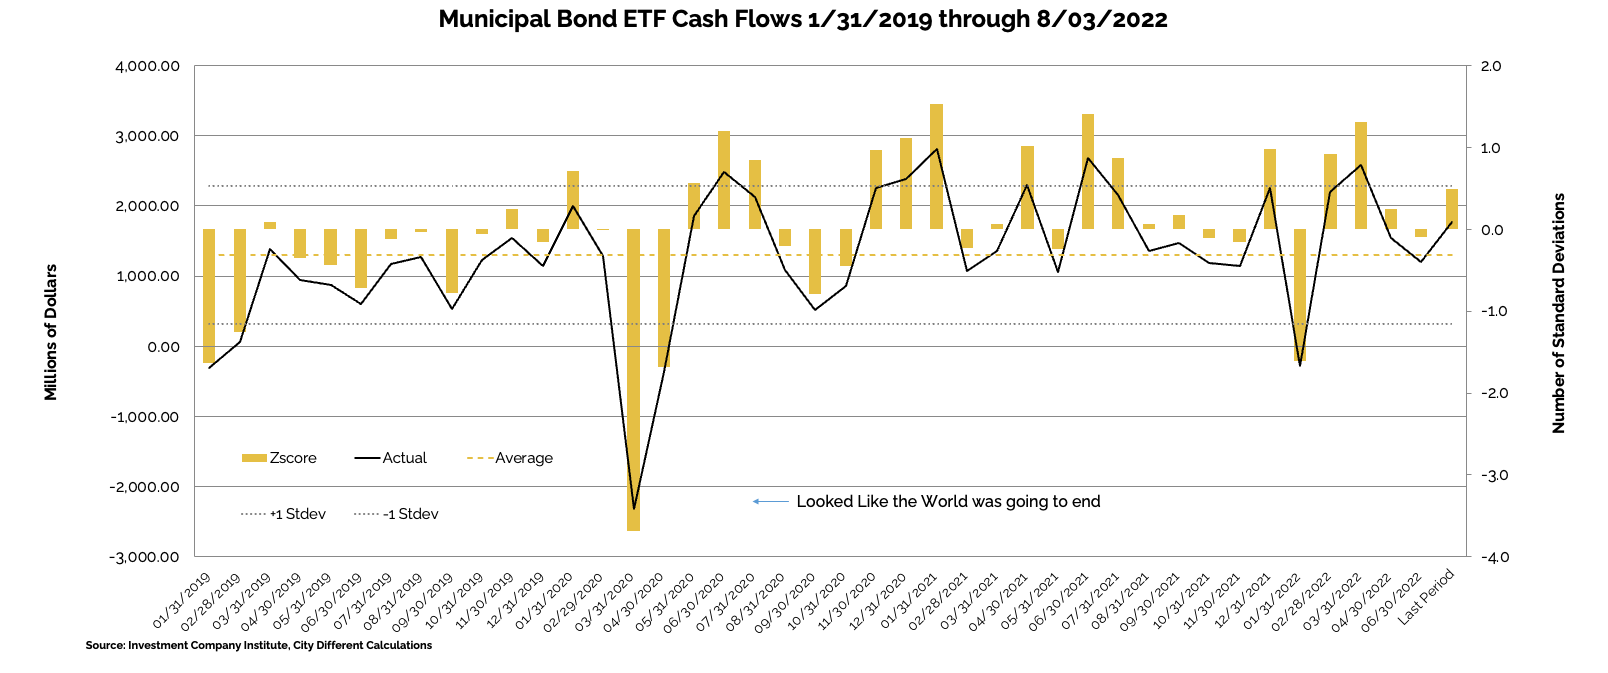
Municipal bond ETF cash flows for the same period were +$352 million, compared to +$879 million the prior week.
 Other cash flow sources:
J.P. Morgan estimated daily fund flows, reported August 12:
• All Muni: -$284 million.
• High-yield Muni: -$7 million.
• Long-term Muni -$56 million.
• Muni ETF -$40 million.
Cumulative fund flows since August 10, estimated:
• All Muni: -$300 million.
• High-yield Muni: -$16 million.
• Long-term Muni -$44 million.
TAXABLE VS. TAX-EXEMPT MUNICIPAL BONDS
The implied tax rate for a taxable vs. a tax-exempt A.A. municipal bond in various maturities are as follows:
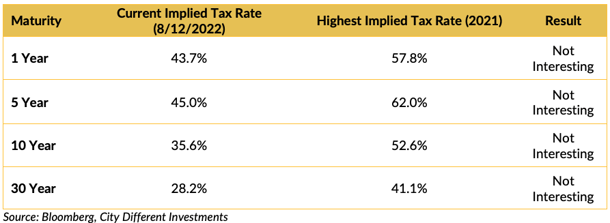
SUPPLY OF NEW ISSUE MUNICIPAL BONDS
In its Municipal Markets Weekly newsletter, JP Morgan commented on the supply picture this week, stating that:
“Next week we expect total supply of $11.3 billion, or 107% of the 5-year equivalent week average ($10.6 billion). We anticipate tax-exempt supply of $7.0 billion (83% of average), while taxable/corp cusip supply of $4.3 billion (2.1x of the average) is the second-highest week of this year.
The supply picture does not get interesting until it exceeds $10 billion tax-exempt issuances in a given week.
CORPORATE INVESTMENT GRADE AND HIGH YIELD OVERVIEW
In U.S. Investment Grade land, new issue activity has petered out as the fixed income market digests the volatility.
In its weekly "Credit Flows" report, Wells Fargo commented:
IG credit spreads tightened 9 bps WoW to 132 bps, the tightest level in ten weeks, as markets rallied following a lower-than-expected CPI print during the week. IG yields decreased 8 bps WoW to 4.4%, generating a total return gain of +0.6% for the week. IG credit curve flattened as intermediate to long end tightened 9-13 bps while front end lagged with 6 bps of tightening. Among sectors, Basics (-13 bps) and Communications (-13 bps) outperformed the index, while Utilities (-6 bps), Tech (-8 bps), and Transportation (-8 bps) led the underperformers.
HY credit spreads tightened 19 bps WoW to 409 bps, a 174 bps rally from its YTD wides in early July. HY yields declined 18 bps to 7.4%, generating the sixth consecutive total return gain for the index. With past week’s gain, HY has extended its YTD outperformance versus IG to 420 bps. Continuing the lower-quality tilt from prior week, CCCs (+1.8%) led the total return gains during the week followed by Bs (+1.2%) and BBs (+0.6%). At the sector level, underperformers were identical to IG with Utilities (0.6%), Transportation (+0.7%), and Tech (+0.8%) reporting the lowest total return gains, while outperformers were led by Non-Cyclicals (+1.2%) and Basics (+1.1%).
CONCLUSION
This was a quiet week in the fixed income markets. Inflation readings were below expectations and the market barely moved. Multiple Fed officials continued to beat the hawkish rate-hike drum — and the market barely moved.
Two things that could move the market are on the horizon. First, the Jackson Hole Economic Summit later this month is the next big Fed event. Second, the balance sheet runoff doubles in September.
This week could be the calm before the storm.
.png?width=500&name=signature%20block%20(3).png)
IMPORTANT DISCLOSURES
The information and statistics contained in this report have been obtained from sources we believe to be reliable but cannot be guaranteed. Any projections, market outlooks or estimates presented herein are forward-looking statements and are based upon certain assumptions. Other events that were not taken into account may occur and may significantly affect the returns or performance of these investments. Any projections, outlooks or assumptions should not be construed to be indicative of the actual events which will occur. These projections, market outlooks or estimates are subject to change without notice.
Please remember that past performance may not be indicative of future results. Different types of investments involve varying degrees of risk, and there can be no assurance that the future performance of any specific investment, investment strategy, or product or any non-investment related content, made reference to directly or indirectly herein will be profitable, equal any corresponding indicated historical performance level(s), be suitable for your portfolio or individual situation, or prove successful. Due to various factors, including changing market conditions and/or applicable laws, the content may no longer be reflective of current opinions or positions.
All indexes are unmanaged, and you cannot invest directly in an index. Index returns do not include fees or expenses. Actual portfolio returns may vary due to the timing of portfolio inception and/or investor-imposed restrictions or guidelines. Actual investor portfolio returns would be reduced by any applicable investment advisory fees and other expenses incurred in the management of an advisory account.
You should not assume that any discussion or information contained herein serves as the receipt of, or as a substitute for, personalized investment advice from City Different Investments. To the extent that a reader has any questions regarding the applicability above to his/her individual situation or any specific issue discussed, he/she is encouraged to consult with the professional advisor of his/her choosing. City Different Investments is neither a law firm nor a certified public accounting firm and no portion of this content should be construed as legal or accounting advice.
A copy of City Different Investments' current written disclosure statement discussing our advisory services and fees is available for review upon request.
Unless otherwise noted, City Different Investments is the source of information presented herein.
A description of the indices mentioned herein are available upon request.