.png)

WEEK ENDING 7/14/2023
Highlights of the week:
- Is inflation on the run?
- Why are consumers more confident?
- “Thank you for your service.”
A CITY DIFFERENT TAKE
The markets received some pretty good news last week. Headline year-over-year CPI (Consumer Price Index) came in at 3.0%, well below last month's 4.0%. That is a significant drop. Is inflation on the run? Is the Fed winning the battle? Well, the core measure tells a slightly different story. Core June CPI year-over-year was reported at 4.8%, a decline from May’s 5.3% and two basis points lower than expectations. The Producer Price Index releases followed the same path. Core CPI at 4.8% still converts to a real yield of -0.97%, a -1.5 standard deviation event, for those keeping score. Based on this good inflation news, the market has put a 92.4% probability for a Fed increase in short rates at their next meeting in July.
The consumer is showing more confidence. The University of Michigan Consumer Sentiment Index for July was released on Friday and came in at 72.6, beating both expectations of 65.5 and June's reading of 64.4.
Actors from the Screen Actors Guild went on strike last week, joining screenwriters and their ongoing Writers Guild of America strike. Nothing good here for the Los Angeles and California economies.
United Parcel Services (UPS) workers are also preparing for a walkout, and Reuters reported on Friday that a UPS strike could be the costliest in the U.S. in a century.
Labor feels confident and is exercising its leverage. With 3.4% unemployment and trillions of dollars hitting the market for infrastructure projects, labor might be right. But with the United Auto Workers union beginning new labor contract negotiations and opening the door for a potential strike, the weather may not be the only thing that is hot this summer.
CHANGES IN RATES
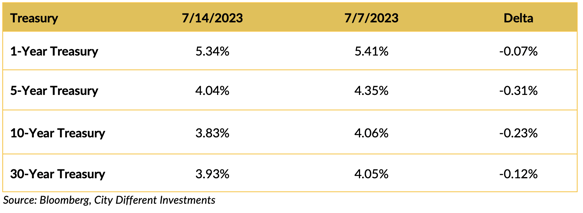
Rates moved lower across the yield curve on the inflation data. The 2-year Treasury Note versus the 10-year Treasury bond spread decreased marginally to -0.91%.
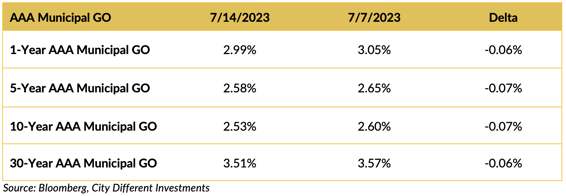
Yields moved slower across the municipal market over the last two weeks but at a much lower level than the Treasury market.
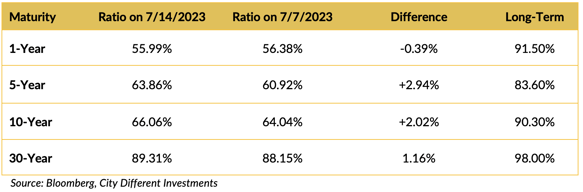
Muni/Treasury ratios are higher for maturities longer than one year. Municipals cheapened relative to Treasuries by this measure.
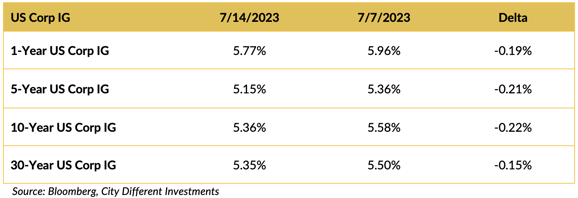
Yield in the investment grade (IG) corporate market decreased over the last week.
THIS WEEK IN WASHINGTON
.png?width=1920&name=graphs%20in%20order%20(1).png)
President Biden returned from a successful European trip. NATO seems unified in its support for Ukraine and expanded its membership with the acceptance of Sweden into the alliance.
Back in the House of Representatives, a normally simple, bipartisan defense spending bill has become quite contentious with the attachment of various culture war amendments. We wonder how Dave Frishberg (of “Schoolhouse Rock!” fame) would have written these lyrics. Why bother wondering? He’d probably be on strike.
The Senate is not much better, with one senator holding up more than 200 military promotions over the same culture war issues. Now that’s what Chris’s father would call a one-finger salute. “Thank you for your service,” indeed.
WHAT, ME WORRY ABOUT INFLATION?
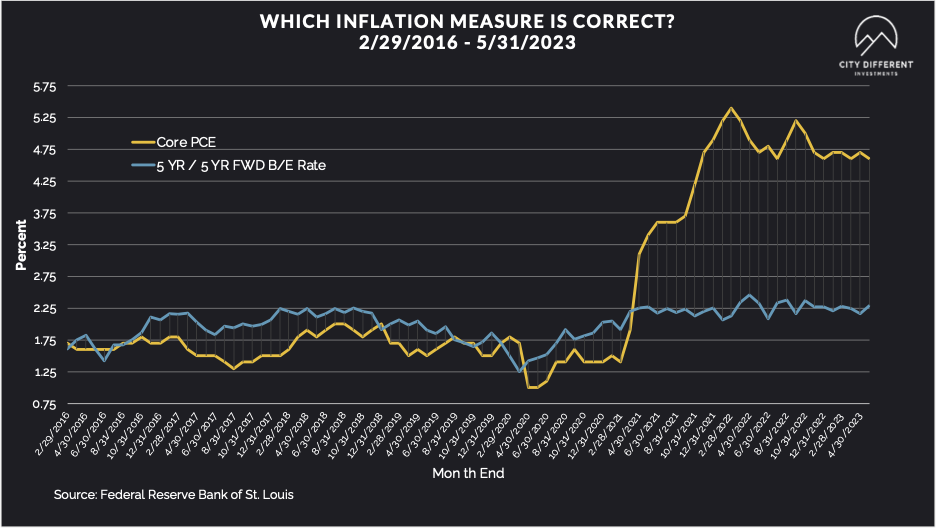
The 5-year Breakeven Inflation Rate finished the week at 2.33%; a one-basis point increase over the July 7 close of 2.32%. The 10-year Breakeven Inflation Rate finished the week at 2.24%; a three-basis point decrease over the July 7 close of 2.27%.
MUNICIPAL CREDIT
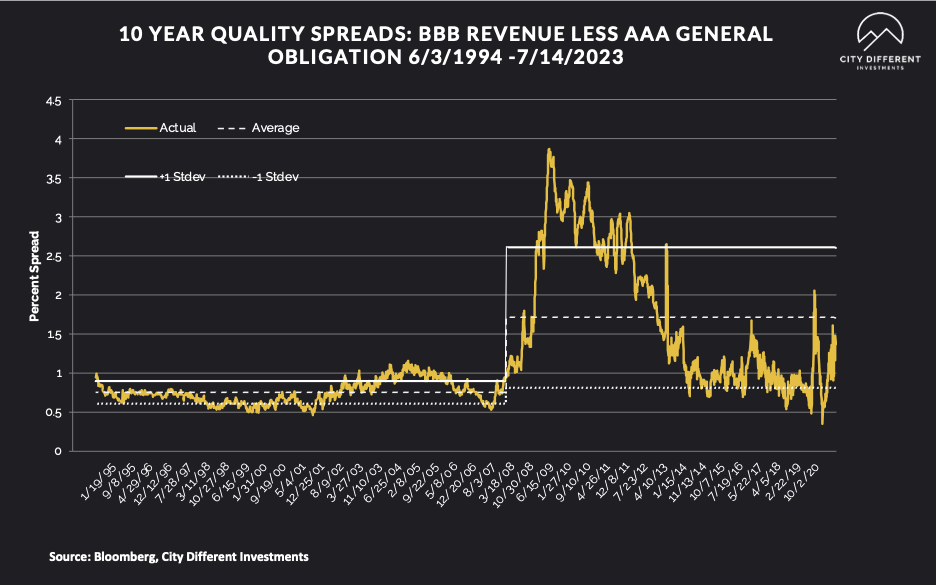
10-year quality spreads (AAA vs. BBB) as of July 14 was 1.41% (based on our calculations), two basis points higher than the July 7 close of 1.39%. The long-term average is 1.71%. By our way of thinking, lower-quality securities are still not attractive but are moving in the right direction.
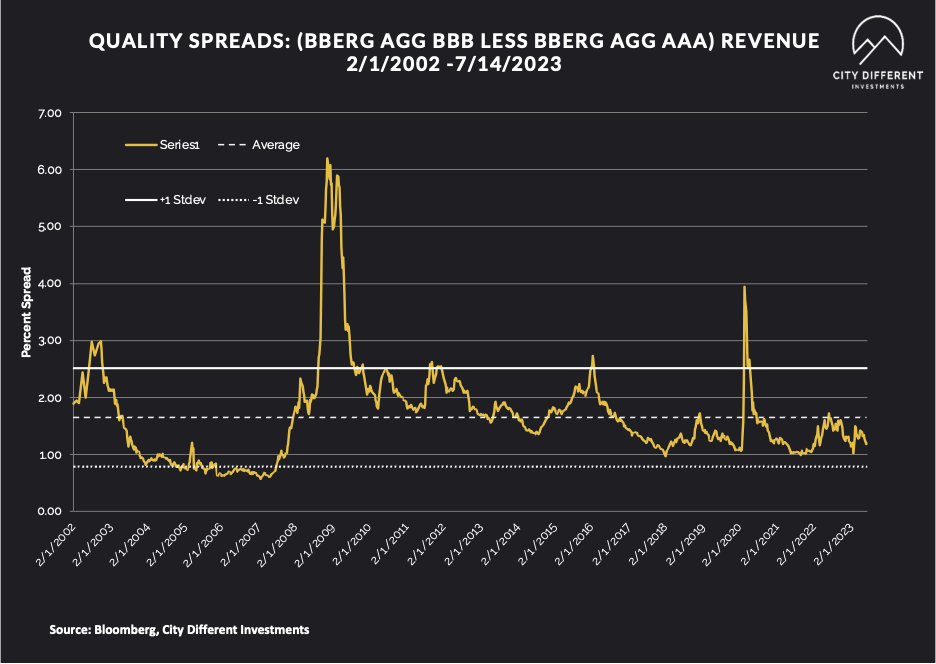
Quality spreads in the taxable market are not attractive but were stable last week, ending the week at 1.19%.
WHERE ARE FIXED-INCOME INVESTORS PUTTING THEIR CASH?
Money Market Flows (millions of dollars)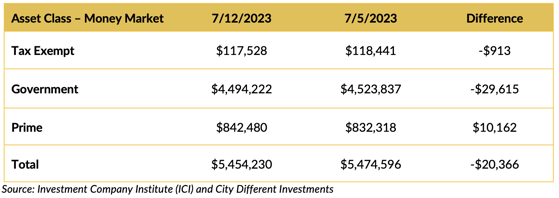
In total, money market funds saw negative cash flows. Has the siren song of money market yields worn off? Or did folks read our blog “Avoiding the Cash Trap” and decide for themselves? Nah, probably just happenstance.
Mutual Fund Flows (millions of dollars)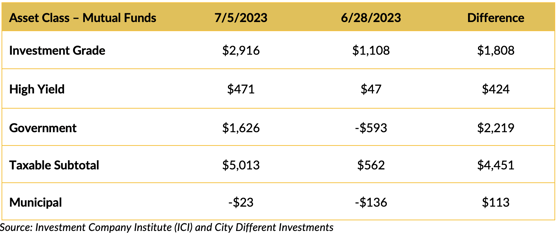
Flows into bond funds are positive.
ETF Fund Flows (millions of dollars)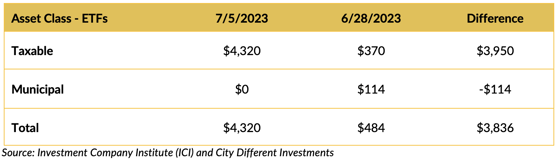
Bond ETFs also saw positive cash flows.
SUPPLY OF NEW ISSUE MUNICIPAL BONDS
This week’s supply is starting to build, with reports slated somewhere around $11.9 billion.
CONCLUSION
The market awaits the Fed’s next move in July. The market is putting high odds on a 25-basis-point increase. Last week’s headline inflation numbers moved the fixed-income markets lower in yields. Core readings still look sticky. The July Fed meeting and the PCE inflation reads should add to the market's volatility (up or down).
IMPORTANT DISCLOSURES
The information and statistics contained in this report have been obtained from sources we believe to be reliable but cannot be guaranteed. Any projections, market outlooks or estimates presented herein are forward-looking statements and are based upon certain assumptions. Other events that were not taken into account may occur and may significantly affect the returns or performance of these investments. Any projections, outlooks or assumptions should not be construed to be indicative of the actual events which will occur. These projections, market outlooks or estimates are subject to change without notice.
Please remember that past performance may not be indicative of future results. Different types of investments involve varying degrees of risk, and there can be no assurance that the future performance of any specific investment, investment strategy, or product or any non-investment related content, made reference to directly or indirectly herein will be profitable, equal any corresponding indicated historical performance level(s), be suitable for your portfolio or individual situation, or prove successful. Due to various factors, including changing market conditions and/or applicable laws, the content may no longer be reflective of current opinions or positions.
All indexes are unmanaged, and you cannot invest directly in an index. Index returns do not include fees or expenses. Actual portfolio returns may vary due to the timing of portfolio inception and/or investor-imposed restrictions or guidelines. Actual investor portfolio returns would be reduced by any applicable investment advisory fees and other expenses incurred in the management of an advisory account.
You should not assume that any discussion or information contained herein serves as the receipt of, or as a substitute for, personalized investment advice from City Different Investments. To the extent that a reader has any questions regarding the applicability above to his/her individual situation or any specific issue discussed, he/she is encouraged to consult with the professional advisor of his/her choosing. City Different Investments is neither a law firm nor a certified public accounting firm and no portion of this content should be construed as legal or accounting advice.
A copy of City Different Investments' current written disclosure statement discussing our advisory services and fees is available for review upon request.
Unless otherwise noted, City Different Investments is the source of information presented herein.
A description of the indices mentioned herein are available upon request.