

WEEK ENDING 07/22/2022
Highlights of the week:
- Big News Week Upcoming — Earnings, Federal Reserve, and Pricing Data
- A Pullback in the Earnings Estimate
- Are We in a Recession?
A CITY DIFFERENT TAKE
This is a big week for the markets, with a heavy volume of earnings releases. Some of the companies reporting this week are tech giants such as Alphabet, Microsoft, Amazon, and Apple.
The other big mover for the week is the Federal Reserve. Markets are waiting for a 75-bps rate hike. Any deviation from that could cause choppy results. The market is looking to the Fed for guidance for September, while the labor market assessment and inflation will be front and center. Headline CPI showed higher-than-expected rental prices. A softening in housing prices, however, should help with inflation numbers. On Friday, the University of Michigan will release its consumer confidence number.
Earnings estimates are slowly reflecting reality, with more realistic expectations on corporate profits as well as lower estimates on earnings. According to Bloomberg, full-year annual growth estimates for U.S. stocks are now at 10.1%; the forecast for Q3 Y/Y EPS growth is now at 8.3%.
Finally… are we in a recession?
The term “recession” is largely understood as a period of two consecutive quarters of falling real GDP. The White House is backing away from that definition, preferring instead to look at factors such as the size of the labor force or consumer credit card debt patterns.
If you still believe in the old-school definition of recession (we don't) then, friends, we are already in one. The Chicago Fed National Activity is a decent indicator of growth; this index is currently negative with the prior month also being negative. This is in tandem with the Atlanta Fed GDPNow model (which has Q2 growth pegged at -1.6%) which says we have two consecutive quarters of negative growth.
This Sunday, Treasury Secretary and former Federal Reserve Chair Janet Yellen spoke to her confidence in the economy and the Fed. She echoed the White House’s stance as far as the labor market. “I would be amazed if the NBER would declare this period to be a recession,” she said. “Even if it happens to have two quarters of negative growth, we’ve got a very strong labor market. When you’re creating almost 400,000 jobs a month, that is not a recession.”
So, this time it’s different?
CHANGES IN RATES
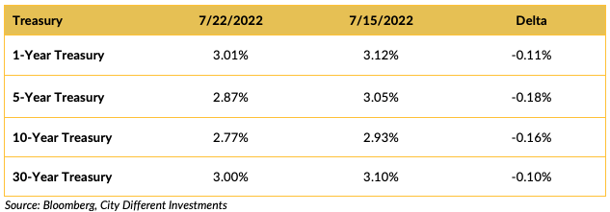
Rates in the Treasury market moved lower last week. The yield curve remained slightly inverted in the 1-to-30-year range. Is this a precursor to a recession? We don’t think so, but what do we know? The Federal Reserve meets this week, and most market participants expect a 75-bps increase in their target for the Fed funds rate.
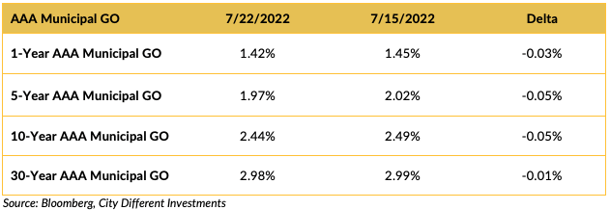
Rates in the municipal market decreased across all categories in the last week.
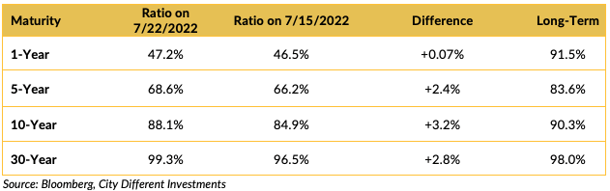
Muni-Treasury ratios increased across the curve in the last week. A higher M/T ratio tends to make Munis a more attractive buy.
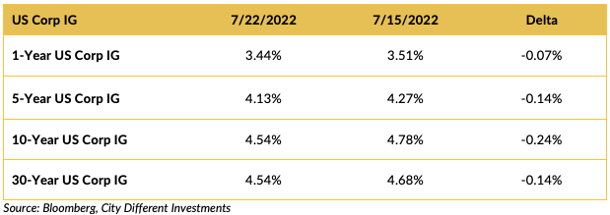
Investment-grade rates were mostly lower last week following the Treasury market’s lead.
THIS WEEK IN WASHINGTON

Things are quiet on the Washington front. President Biden seems to be fighting COVID-19 really well. This is the second sitting U.S. president to get hit by COVID in the last three years.
While the January 6 committee is on a break, the main political show this week is former President Donald Trump coming back to Washington, weighing another run for the White House.
WHAT, ME WORRY ABOUT INFLATION?

The 5-year Breakeven Inflation Rate ended the week at 2.12%, pretty much unchanged from last week’s closing 2.13%. The same can be said for the 10-year Breakeven Inflation Rate ending the week at 2.34% versus last week’s 2.36%.
MUNICIPAL CREDIT
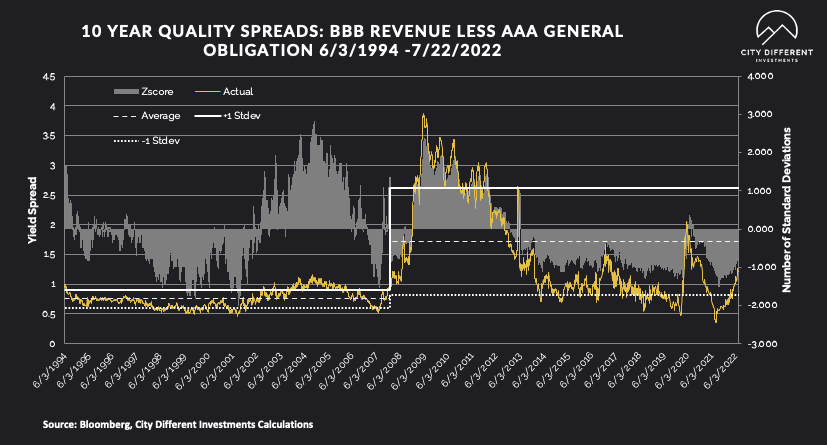
While we saw an increase in rates, credit spreads remained steady.
WHY IS THE MUNICIPAL MARKET BEHAVING THIS WAY?
Various sources are used to report cash flows related to municipal bond mutual funds and ETFs, all reporting at different times. The source we have chosen to use is the Investment Company Institute (I.C.I.). The I.C.I. reported weekly cash flows from municipal bond mutual funds for the week of July 13, as +$543 million compared to -$1.1 billion from the week before.
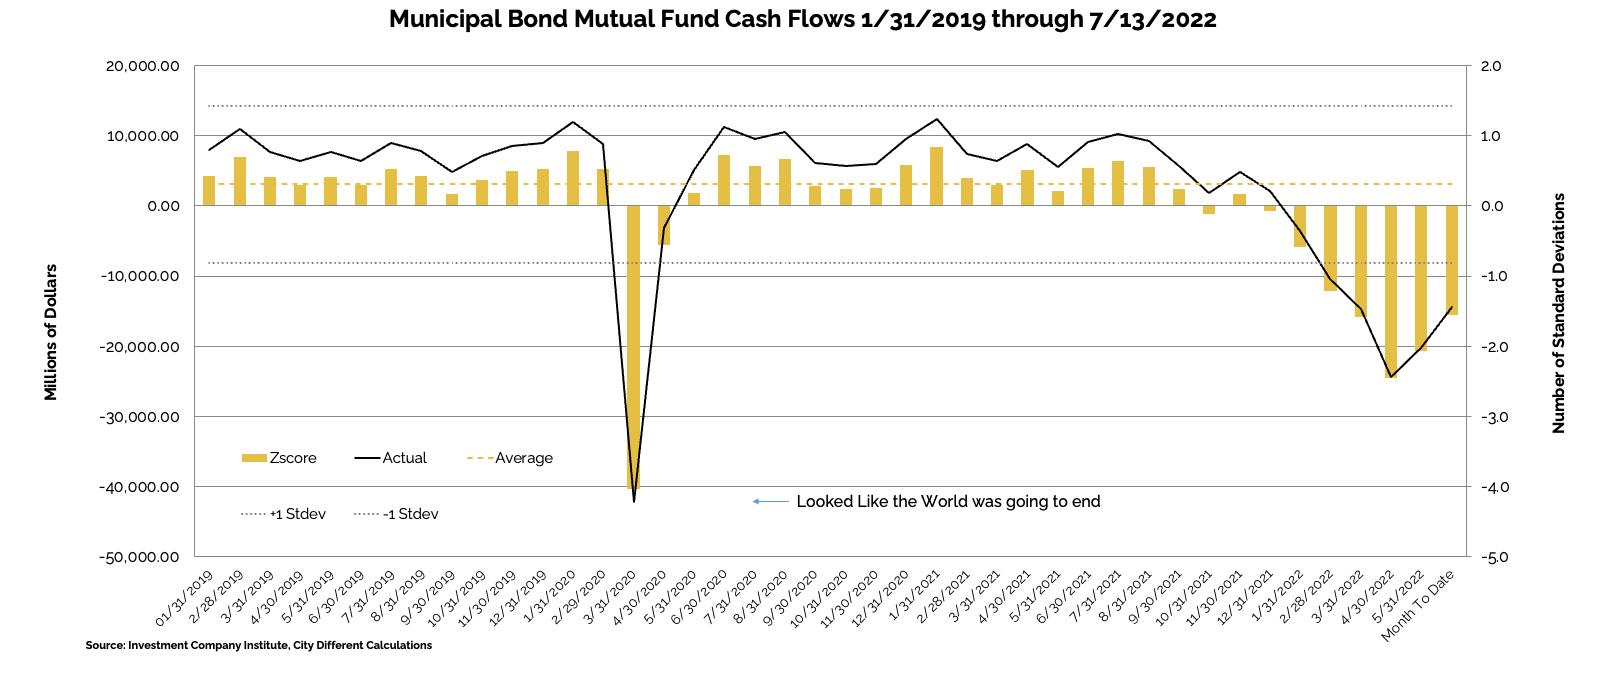
Municipal bond ETF cash flows for the same period were -$347 million, compared to +$916 million the prior week.

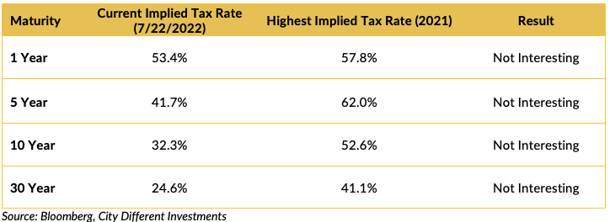
TAXABLE VS. TAX-EXEMPT MUNICIPAL BONDS
The implied tax rate for a taxable vs. a tax-exempt A.A. municipal bond in various maturities is as follows:
SUPPLY OF NEW ISSUE MUNICIPAL BONDS
In its Municipal Markets Weekly newsletter, JP Morgan commented on the supply picture this week, stating that:
“Next week, we expect total supply of only $2.6 billion, or 35% of the 5-year equivalent week average ($7.5 billion), as issuers seek to avoid volatility associated with the July FOMC meeting. We anticipate tax-exempt supply of $2.4 billion (43% of average), while taxable/corp cusip supply of just $0.2 billion (11% of average) remains subdued.”
The supply picture does not get interesting until it exceeds $10 billion tax-exempt issuances in a given week.
CORPORATE INVESTMENT GRADE AND HIGH YIELD OVERVIEW
In U.S. Investment Grade land, new issue activity has petered out as the fixed income market digests the volatility.
In its weekly "Credit Flows" report, Wells Fargo commented:
“Inflation 1, Recession 2. This year’s main story was always the race between inflation and recession risk, with the former and resulting monetary policy tightening leading initially and the latter catching up over the course of the year, culminating in recession likely after 2022. Over the past month or so rates investors have started pricing in imminent recession as 3s/5s inverted and duration began to perform. At the same time credit investors see little damage to fundamentals and thus extrapolate limited risk this recession — hence the rally in spreads.
Disagree. We disagree with market pricing as the US economy appears strong when judged by the June jobs report, which showed broad based jobs creation and a low unemployment rate. That means the Fed has to continue tightening monetary policy aggressively — we would be short risk into Wednesday’s FOMC meeting on 75bps rate hike, in line with consensus, but a hawkish Fed Chair Powel during the press conference. After that the Fed should continue hiking rates well into 2023 — in contrast to the February net rate ease priced into the rates market.
Shallow? Suppose on the other hand the US is either already in recession or about to enter one — then today’s preliminary reading on S&P Global Services PMI for July has to be disturbing coming in at 47.5 vs. 52.7 consensus. While that would validate the recent move in rates, it is at odds with the rally in credit spreads as such contraction is more consistent with a normal recession than a shallow one. We continue to look for 200bps, 800bps and $89 for IG, HY and loans, respectively, with the relevant risk being even wider spreads and lower prices.
Winter is coming, redux. Natural gas apparently again is flowing through Nord Stream 1 to Europe and especially Germany — but at reduced capacity. Keep in mind that the higher capacity Russia allows, the more Europe can replenish inventories before winter and the less powerful Russia's weapon of shutting down the pipeline when it gets colder will be. So incentives strongly favor Russia to find ways to severely restrict the flow of natural gas through the pipelines. Much more to come on this story in coming weeks and months. Clear risk to the downside for risk assets around the geopolitics of this and downside risk to the European and global economy.
European sovereign crisis, redux. The ECB hiked rates by 50bps, twice what they had signaled in the past. During the following press Italian sovereign yields widened as President Lagarde described the new tool (TPI=Transmission Protection Instrument) to protect against widening peripheral sovereign spreads. 10-year Italy spreads are now 228bps vs 242bps on June 14 before the tool was announced and 171bps in between on July 1. Details of the TPI were vague — not clear how countries satisfy the subjective requirements for intervention and especially how much sovereign spread widening the ECB will tolerate. Look for markets to find an excuse to test the ECB = negative for risk assets.”
CONCLUSION
- An exciting combination of corporate earnings, Federal Reserve decisions, and economic releases will keep the markets on its toes this week.
- We are finally seeing sky-high earnings guidance come down to meet the reality of corporate earnings.
- And as the White House redefines a recession, we ask “is it truly different this time?”
.png?width=500&name=signature%20block%20(3).png)
IMPORTANT DISCLOSURES
The information and statistics contained in this report have been obtained from sources we believe to be reliable but cannot be guaranteed. Any projections, market outlooks or estimates presented herein are forward-looking statements and are based upon certain assumptions. Other events that were not taken into account may occur and may significantly affect the returns or performance of these investments. Any projections, outlooks or assumptions should not be construed to be indicative of the actual events which will occur. These projections, market outlooks or estimates are subject to change without notice.
Please remember that past performance may not be indicative of future results. Different types of investments involve varying degrees of risk, and there can be no assurance that the future performance of any specific investment, investment strategy, or product or any non-investment related content, made reference to directly or indirectly herein will be profitable, equal any corresponding indicated historical performance level(s), be suitable for your portfolio or individual situation, or prove successful. Due to various factors, including changing market conditions and/or applicable laws, the content may no longer be reflective of current opinions or positions.
All indexes are unmanaged, and you cannot invest directly in an index. Index returns do not include fees or expenses. Actual portfolio returns may vary due to the timing of portfolio inception and/or investor-imposed restrictions or guidelines. Actual investor portfolio returns would be reduced by any applicable investment advisory fees and other expenses incurred in the management of an advisory account.
You should not assume that any discussion or information contained herein serves as the receipt of, or as a substitute for, personalized investment advice from City Different Investments. To the extent that a reader has any questions regarding the applicability above to his/her individual situation or any specific issue discussed, he/she is encouraged to consult with the professional advisor of his/her choosing. City Different Investments is neither a law firm nor a certified public accounting firm and no portion of this content should be construed as legal or accounting advice.
A copy of City Different Investments' current written disclosure statement discussing our advisory services and fees is available for review upon request.
Unless otherwise noted, City Different Investments is the source of information presented herein.
A description of the indices mentioned herein are available upon request.