.png)

WEEK ENDING 07/15/2022
Highlights of the week:
- Hot inflation! Choose-your-flavor - headline CPI or PPI Y/Y. Both beat expectations, along with core inflation.
- Just when your think COVID-19 is in the rearview mirror, a new variant (BA.5) rears its ugly head.
- The Secret Service doesn’t know how to use cellphones!
- A rate increase of 75 basis points seems like a safe bet when the Federal Reserve meets next on July 27.
A CITY DIFFERENT TAKE
Last week’s inflation measures came in hotter than expected. Some pundits are pointing to a decrease in commodity prices as an indicator that peak inflation is behind us. We have been thinking about that assessment and we’re not so sure it holds water, especially with the increase in the COVID-19 variant “BA.5” infection rates.
Commodity prices are declining (just look at gas prices at the pump). Is that because of the demand destruction caused by the Fed’s increase in short-term rates? The reports from the nation’s airports over the July 4th holiday weekend would suggest not. More travelers were willing to pay 40% higher fares, but the airlines could not produce enough flight crews to accommodate these customers — classic supply chain disruption.
Simply put, inflation is caused by too much money chasing too few goods. On the money side of the equation, the last observation of M2 money supply aggregate on May 1 was only 0.25% below the maximum figure observed on March 1. Supply chain disruptions and shipping rates seemed to have decreased with peak COVID in the rearview mirror, but the BA.5 variant impacting the United Sates brings that assumption into question. This will be especially true if China decides to shut down to fight the disease.
Interest rates are significantly higher than they were at the beginning of the year, but we feel they aren’t high enough to compensate investors for these increased risks. Jump to the “conclusion” section to see what steps we are taking at CDI.
CHANGES IN RATES
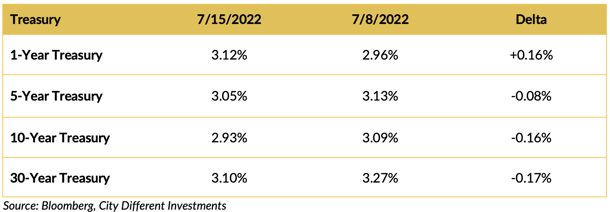
Rates in the Treasury market moved lower last week, and the slope of the yield curve flattened. Segments of the yield curve invert and we’ll have to see if this is an ongoing trend.
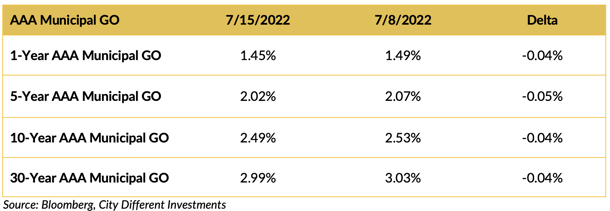
Rates in the municipal market decreased in the last week.
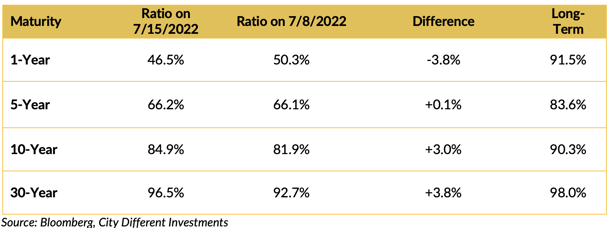
Muni-Treasury ratios decreased in the short end of the market and increased in the long end of the market from last week and remain on the rich side of fair (as we calculate the fair range). A higher M/T ratio tends to make Munis a more attractive buy.
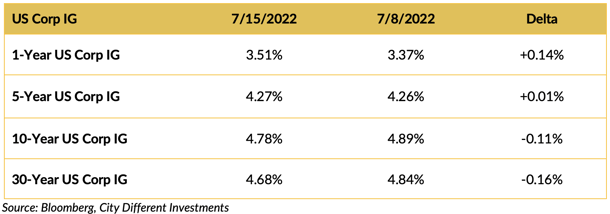
Investment-grade rates were mostly lower last week following the Treasury market’s lead.
THIS WEEK IN WASHINGTON

Though President Biden was out of the county last week visiting the Middle East, Washington still seemed to generate some headlines.
- The President’s fist bump with “MBS” generated a lot of attention. A fist bump seems like the least you can do for the host country when you come hat-in-hand looking for more oil production. (Yeah, we said it. But I think most of you are thinking it!)
- Senator Manchin declared that he would not support more spending because of inflation pressures, nor would he support higher taxes (two key components of Biden’s domestic agenda), effectively killing the current climate and tax bill.
- The Secret Service was unable to produce agent text messages sent on January 5 and January 6, 2021. (We wonder if they could produce them for the 4th or the 7th) The agency has been subpoenaed by the January 6 committee with a Tuesday deadline to produce the texts. Seems like cellphone illiteracy is a test all Secret Service candidates must pass. If all else fails, just tell them the guard dogs ate the cellphones. Yeah, that’s it.
If you put this stuff in a movie, no one would believe it!
WHAT, ME WORRY ABOUT INFLATION?
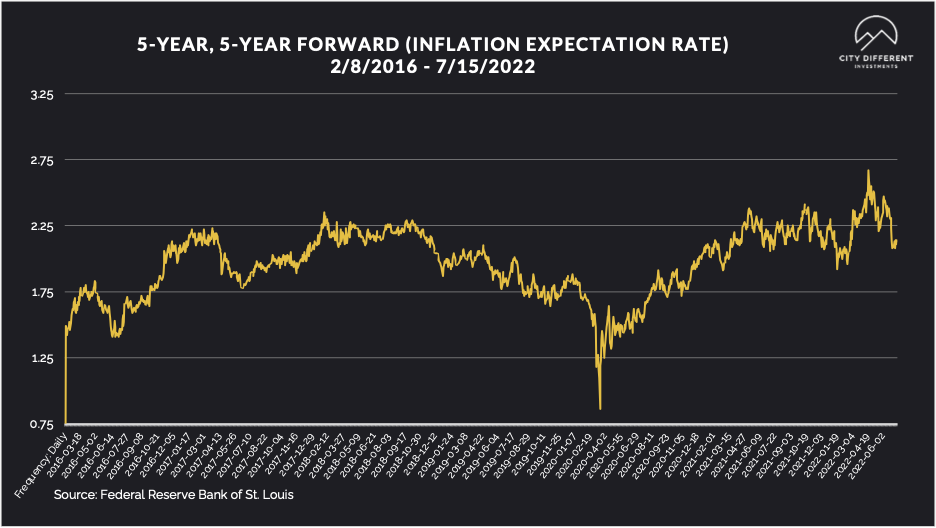
The 5-year Breakeven Inflation Rate ended the week at 2.13%, pretty much unchanged from last week’s closing 2.12%. The same can be said for the 10-year Breakeven Inflation Rate ending the week at 2.36% versus last week’s 2.37%.
MUNICIPAL CREDIT
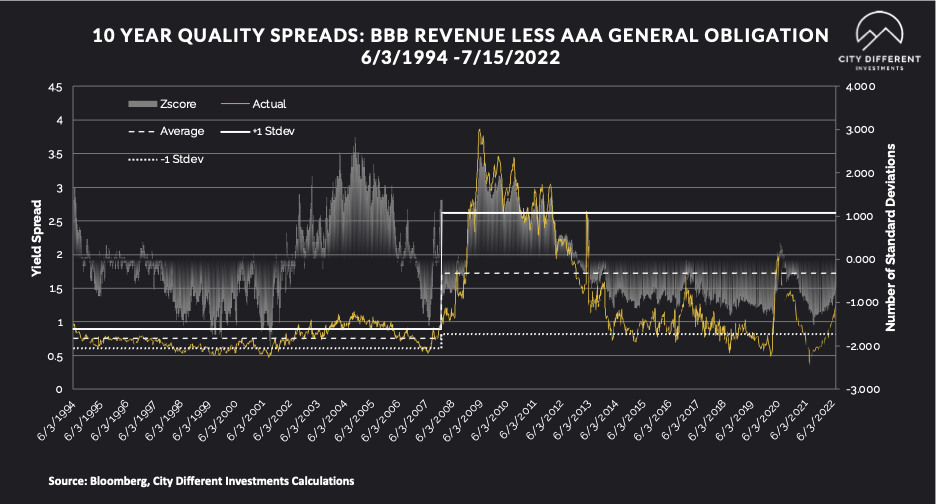
While we saw an increase in rates, credit spreads remained steady.
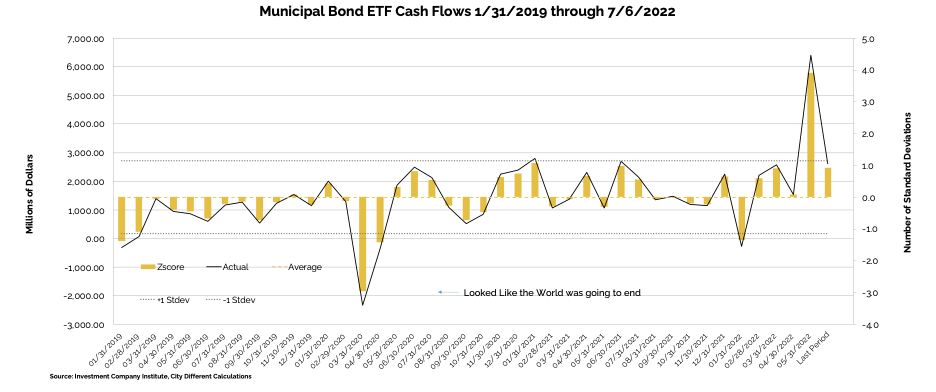
WHY IS THE MUNICIPAL MARKET BEHAVING THIS WAY?
Various sources are used to report cash flows related to municipal bond mutual funds and ETFs, all reporting at different times. The source we have chosen to use is the Investment Company Institute (I.C.I.). The I.C.I. reported weekly cash flows from municipal bond mutual funds for the week of July 6, as -$1.1 billion compared to -$1.4 billion from the week before.
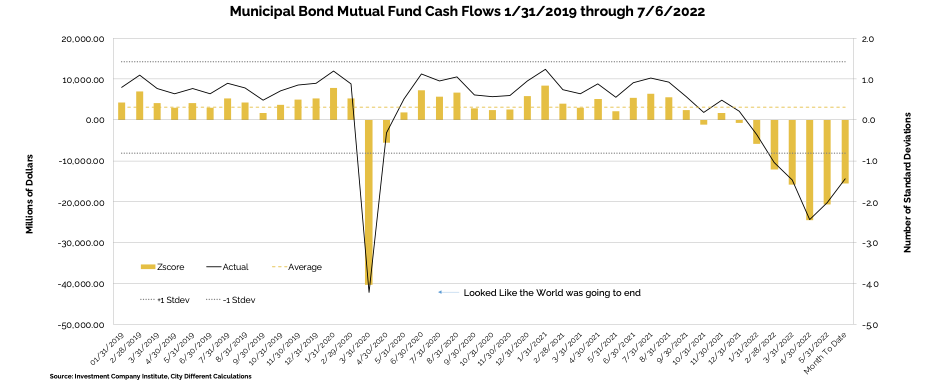
Municipal bond ETF cash flows for the same period were +916 million, compared to +690 million the prior week.
Lipper reported combined weekly and monthly outflows of $2.5 billion for the period ending July 13, increasing YTD outflows to $80.2 billion. Cumulative outflows over the past 27 weeks total a record $81.2 billion.
TAXABLE VS. TAX-EXEMPT MUNICIPAL BONDS
The implied tax rate for a taxable vs. a tax-exempt A.A. municipal bond in various maturities is as follows:
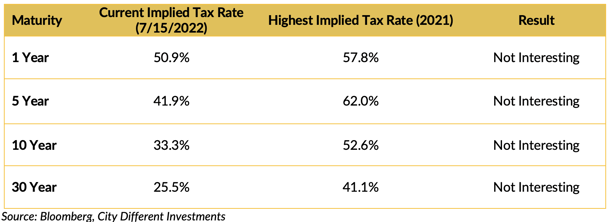
Municipal bonds have given back some of the rally that they experienced a week ago, catching up to their taxable counterparts.
SUPPLY OF NEW ISSUE MUNICIPAL BONDS
In its Municipal Markets Weekly newsletter, JP Morgan commented on the supply picture this week, stating that:
“Next week, we expect total supply of $7.3 billion, or 69% of the 5-year equivalent average ($10.6 billion). We anticipate tax-exempt supply of $6.8 billion (77% of average), while taxable/corp cusip supply of just $0.5 billion (28% of average) remains subdued.
1H2022 fund flows by fund complex of $76 billion (including ETFs), would be the biggest full-year outflow by volume and percent of AUM (7%), since the inception of the data in 1992. Interestingly, municipal ETFs registered $12 billion of inflows, or 15% of AUM, despite the worst YTD market performance since the 1980s.”
The supply picture does not get interesting until it exceeds $10 billion tax-exempt issuances in a given week.
CORPORATE INVESTMENT GRADE AND HIGH YIELD OVERVIEW
In U.S. Investment Grade land, new issue activity has petered out as the fixed income market digests the volatility.
In its weekly "Credit Flows" report, Wells Fargo commented:
“Flows pointed to worsening demand for USD credit versus positive momentum across EUR credit this past week. Primary market activity in US IG was dominated by event-driven supply and Yankee deals against the backdrop of Q2 earnings quiet periods, while deal activity stalled out across most other markets. In the prior week, dealer inventories in IG dropped sharply for a second straight week and net short positions in HY nearly doubled.”
CONCLUSION
We do not share the view that peak inflation is behind us. We are targeting durations in all our SMAs at “below midpoint neutral.” Due to the expensive nature of short-term municipal securities (1 year and shorter) we are utilizing taxable money market funds to fill that rung of our laddered portfolios.
.png?width=500&name=signature%20block%20(3).png)
IMPORTANT DISCLOSURES
The information and statistics contained in this report have been obtained from sources we believe to be reliable but cannot be guaranteed. Any projections, market outlooks or estimates presented herein are forward-looking statements and are based upon certain assumptions. Other events that were not taken into account may occur and may significantly affect the returns or performance of these investments. Any projections, outlooks or assumptions should not be construed to be indicative of the actual events which will occur. These projections, market outlooks or estimates are subject to change without notice.
Please remember that past performance may not be indicative of future results. Different types of investments involve varying degrees of risk, and there can be no assurance that the future performance of any specific investment, investment strategy, or product or any non-investment related content, made reference to directly or indirectly herein will be profitable, equal any corresponding indicated historical performance level(s), be suitable for your portfolio or individual situation, or prove successful. Due to various factors, including changing market conditions and/or applicable laws, the content may no longer be reflective of current opinions or positions.
All indexes are unmanaged, and you cannot invest directly in an index. Index returns do not include fees or expenses. Actual portfolio returns may vary due to the timing of portfolio inception and/or investor-imposed restrictions or guidelines. Actual investor portfolio returns would be reduced by any applicable investment advisory fees and other expenses incurred in the management of an advisory account.
You should not assume that any discussion or information contained herein serves as the receipt of, or as a substitute for, personalized investment advice from City Different Investments. To the extent that a reader has any questions regarding the applicability above to his/her individual situation or any specific issue discussed, he/she is encouraged to consult with the professional advisor of his/her choosing. City Different Investments is neither a law firm nor a certified public accounting firm and no portion of this content should be construed as legal or accounting advice.
A copy of City Different Investments' current written disclosure statement discussing our advisory services and fees is available for review upon request.
Unless otherwise noted, City Different Investments is the source of information presented herein.
A description of the indices mentioned herein are available upon request.