

WEEK ENDING 07/08/2022
Highlights of the week:
- Nonfarm payrolls increased by 372,000 in June.
- The consumer price index might hit an all-time high when its June report is released this Wednesday.
- Federal Reserve expected to move forward with another 75-bps rate hike.
A CITY DIFFERENT TAKE
The U.S. labor market remains strong. 372,000 new jobs were added in June, beating the consensus estimate of 250,000, while the jobless rate remained at 3.6% (still the lowest in the last 50 years). Job openings remain at a record 11.3 million, or to put it another way, 1.9 jobs for every unemployed person the United States. Wages also increased by 5.1% year-over-year.
The consumer price index is the new big number coming out on Wednesday this week. Expectations are to see a number pushed higher by June’s increasing gas and rent prices.
Because of the strong employment number, we should see a 75-bps interest rate hike in July. The Federal Reserve will use the strength of the job market as one indicator to justify being hawkish.
CHANGES IN RATES
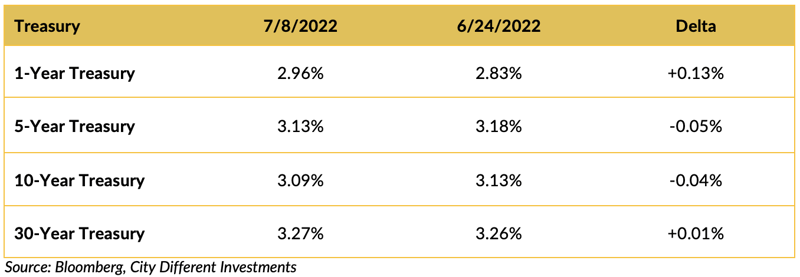
Rates in the Treasury market moved lower last week, and the slope of the yield curve flattened.
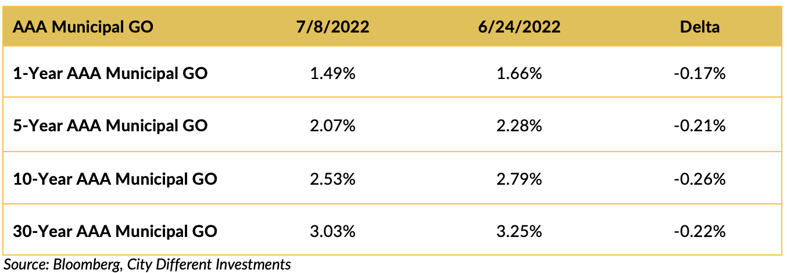
Rates in the municipal market decreased in the holiday shortened week and the curve marginally flattened.
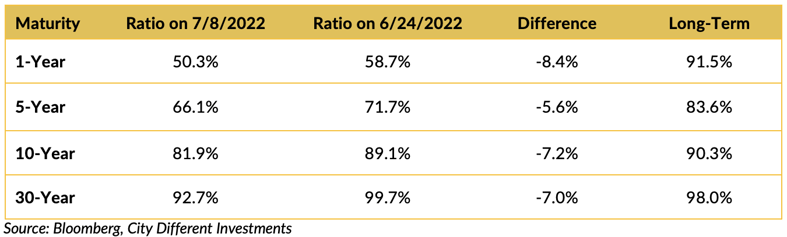
Muni-Treasury ratios decreased from last week and remain on the rich side of fair (as we calculate the fair range). A higher M/T ratio tends to make Munis a more attractive buy.
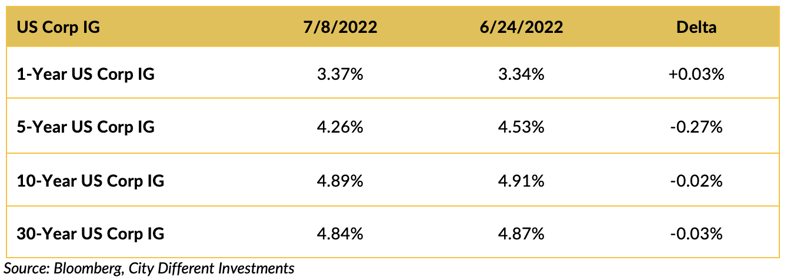
Investment-grade rates were lower last week following the Treasury market’s lead.
THIS WEEK IN WASHINGTON

President Biden looks to get his economic agenda passed before Congress’s summer recess begins on August 8. For the bill to pass by a simple majority in the Senate, all 50 members of the Democratic caucus must vote for it.
Some of the key components of the budget bill are:
- Installing a 15% corporate minimum tax on book profits.
- Allowing Medicare to negotiate drug pricing.
- Requiring a 3.8% health surcharge on some income from pass-through businesses to fund Medicare.
- Securing $550 billion for climate change initiatives.
WHAT, ME WORRY ABOUT INFLATION?
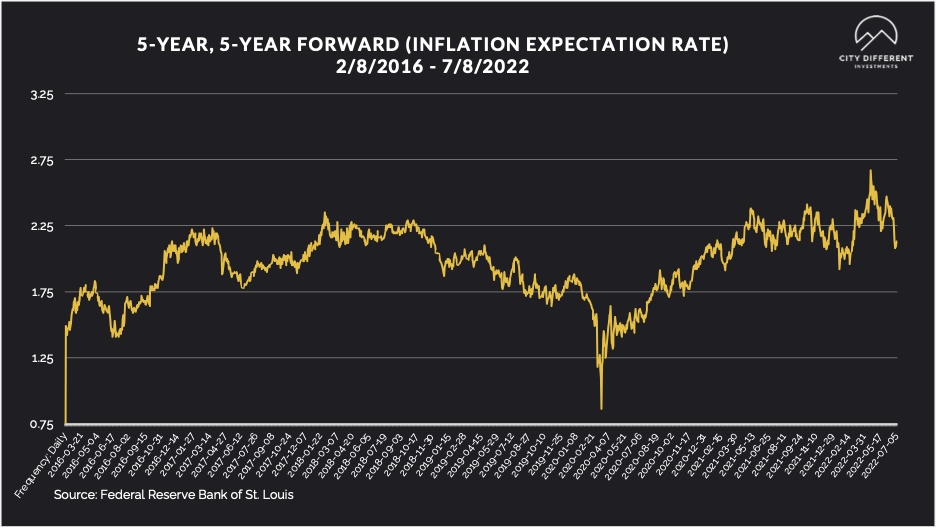
The 5-year Breakeven Inflation Rate ended the week at 2.12%, down 18 basis points from 2.30% the week of June 24. The 10-year Breakeven Inflation Rate was 2.37% at week's end, down 19 basis points lower from 2.56% the week of June 24.
MUNICIPAL CREDIT
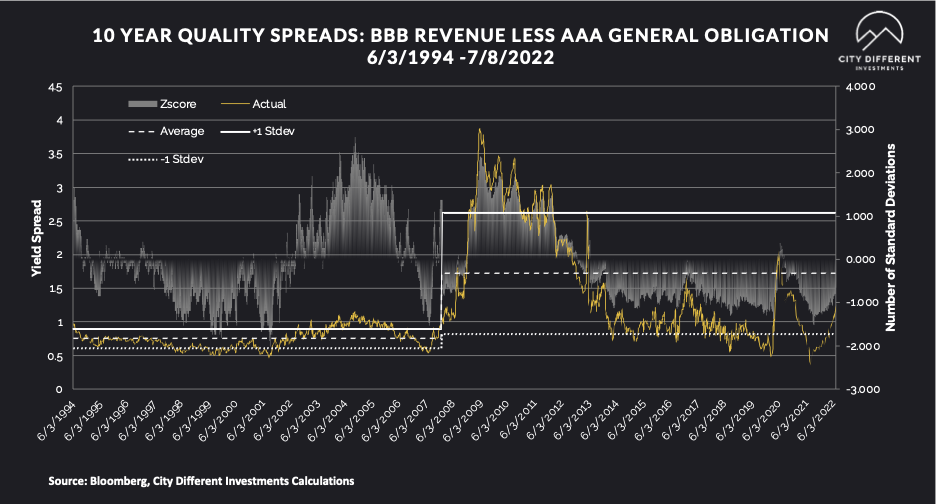
While we saw an decrease in rates, credit spreads remained steady.
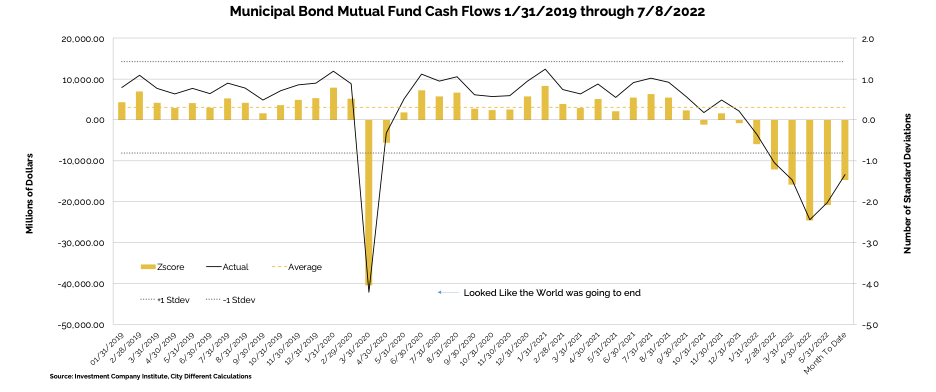
WHY IS THE MUNICIPAL MARKET BEHAVING THIS WAY?
Various sources are used to report cash flows related to municipal bond mutual funds and ETFs, all reporting at different times. The source we have chosen to use is the Investment Company Institute (I.C.I.). The I.C.I. reported weekly cash flows from municipal bond mutual funds for the week of June 29 as -$1.4 billion compared to -$4.6 billion from the week before.
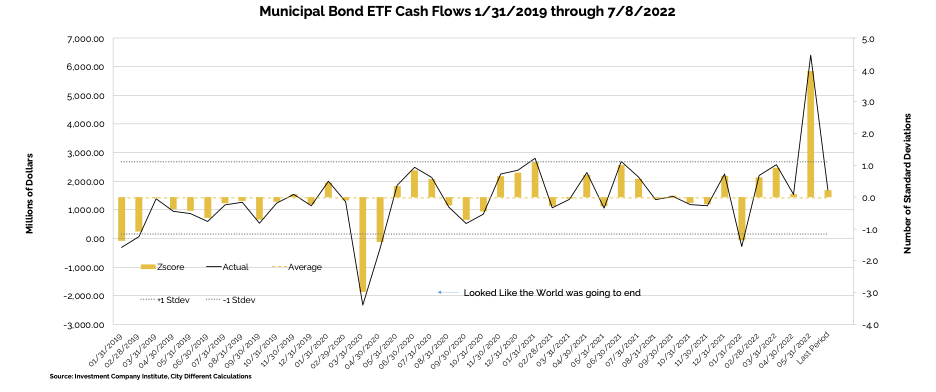
Municipal bond ETF cash flows for the same period were +$690 million, compared to +$1.2 billion the prior week.
Lipper reported combined weekly and monthly outflows of $1.7 billion for the period ending July 6, increasing record YTD outflows to $77.7 billion. Cumulative outflows over the past 26 weeks total a record $78.7 billion.
TAXABLE VS. TAX-EXEMPT MUNICIPAL BONDS
The implied tax rate for a taxable vs. a tax-exempt A.A. municipal bond in various maturities is as follows:
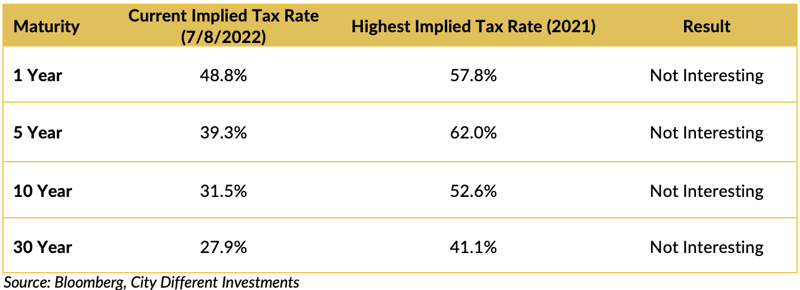
Municipal bonds have given back some of the rally that they experienced a week ago, catching up to their taxable counterparts.
SUPPLY OF NEW ISSUE MUNICIPAL BONDS
In its Municipal Markets Weekly newsletter, JP Morgan commented on the supply picture this week, stating that:
“Next week, we expect total supply of $10.3 billion, or 106% of the 5-year equivalent average ($9.7 billion). We anticipate tax-exempt supply of $9.9 billion (132% of average) and the 2nd highest of the year.”
The supply picture does not get interesting until it exceeds $10 billion tax-exempt issuances in a given week.
CORPORATE INVESTMENT GRADE AND HIGH YIELD OVERVIEW
In U.S. Investment Grade land, new issue activity has petered out as the fixed income market digests the volatility.
In its weekly "Credit Flows" report, Wells Fargo commented:
“Mind the gap between wages and unemployment. The recent rebound in risk assets from June lows seems to build on the notion that monetary policy tightening as priced in markets is more than sufficient to allow the Fed to accomplish its objective of lowering inflation to more acceptable levels. Moreover some are pointing out that with Atlanta Fed’s GDPNow 2Q forecast at -1.87% - i.e. suggesting negative GDP readings for consecutive quarters - the economy is already in recession, implying lows have been reached for risky assets. We disagree.
The importance of the jobs report for June is in part there were no signs of recession whatsoever, as jobs growth remained strong and broad-based. Moreover there was not even a hint of evidence the Fed is making any progress in fighting wage inflation, which is necessary in order to get overall inflation levels under control. In fact Average Hourly Earnings growth remained above 5% and came in higher than expectations on a YoY basis, while the unemployment rate is stuck at a very low 3.6%. In contrast, in order to materially bring down wage inflation the Fed must tighten monetary policy so much that the employment rate increases markedly. In other words, not only is there room for the Fed to tighten monetary policy much more as the economy appears quite strong – it is also necessary with no indication wage inflation is letting up. That means we’re far from the lows in risky asset prices.
Debt vs. Equity. US credit significantly underperformed equities during the first half of the year both on the IG and HY sides. However, rather than suggesting credit is now cheap vs. equities across board our simple fitted models of credit spreads relative to equity and interest rate volatilities, commodity prices and the share of CCCs in HY suggest instead credit underperformance was mostly about catching up from extremely expensive levels. What prompted this repricing of credit relative to other asset classes was markets pricing in monetary policy tightening and likely outflows instead of extreme easing and massive inflows. We would not expect credit to continue underperforming to the same extent seen in 1H2022.
From P/E to E. While obviously the equity market (and thus credit) has struggled this year with the implications of higher interest rates – especially as that translates into a lower multiples –attention now turns to the 2Q22 earnings reporting season. The key risk is disappointing results and guidance – typically more on the equities side than for credit.
2Q22 Earnings Preview. Consensus estimates for revenue and earnings point to positive single-digit growth for both IG and HY companies. Even so, if these expectations realized, 2Q would mark the fourth consecutive quarterly decline in both top- and bottom-line performance and the lowest growth rates since 4Q20. Excluding commodity-related sectors, revenue expectations are even lower while earnings growth could come in close to flat or even negative.”
CONCLUSION
The recent jobs report shows a robust U.S. labor market with record low unemployment. A similar report on the consumer price index comes out this Wednesday with the expectation of a number lingering around the 8%. The Federal Reserve enters into a blackout period for its July meeting, ahead of which the bond market is pricing a 0.75% increase in interest rates.
.png?width=500&name=signature%20block%20(3).png)
IMPORTANT DISCLOSURES
The information and statistics contained in this report have been obtained from sources we believe to be reliable but cannot be guaranteed. Any projections, market outlooks or estimates presented herein are forward-looking statements and are based upon certain assumptions. Other events that were not taken into account may occur and may significantly affect the returns or performance of these investments. Any projections, outlooks or assumptions should not be construed to be indicative of the actual events which will occur. These projections, market outlooks or estimates are subject to change without notice.
Please remember that past performance may not be indicative of future results. Different types of investments involve varying degrees of risk, and there can be no assurance that the future performance of any specific investment, investment strategy, or product or any non-investment related content, made reference to directly or indirectly herein will be profitable, equal any corresponding indicated historical performance level(s), be suitable for your portfolio or individual situation, or prove successful. Due to various factors, including changing market conditions and/or applicable laws, the content may no longer be reflective of current opinions or positions.
All indexes are unmanaged, and you cannot invest directly in an index. Index returns do not include fees or expenses. Actual portfolio returns may vary due to the timing of portfolio inception and/or investor-imposed restrictions or guidelines. Actual investor portfolio returns would be reduced by any applicable investment advisory fees and other expenses incurred in the management of an advisory account.
You should not assume that any discussion or information contained herein serves as the receipt of, or as a substitute for, personalized investment advice from City Different Investments. To the extent that a reader has any questions regarding the applicability above to his/her individual situation or any specific issue discussed, he/she is encouraged to consult with the professional advisor of his/her choosing. City Different Investments is neither a law firm nor a certified public accounting firm and no portion of this content should be construed as legal or accounting advice.
A copy of City Different Investments' current written disclosure statement discussing our advisory services and fees is available for review upon request.
Unless otherwise noted, City Different Investments is the source of information presented herein.
A description of the indices mentioned herein are available upon request.