

WEEK ENDING 06/17/2022
Highlights of the week:
- Surprise. The Federal Reserve announces a 75-bps increase.
- The Fed's desperation rings recession alarms.
- President Biden's approval rating falls lower than ever. Can the same be said for his re-election chances?
A CITY DIFFERENT TAKE
Last week we discussed the expectation that the Fed would announce a 50-bps increase at their June 15 meeting. Turns out the Fed was even more aggressive than anticipated and raised rates by 75 basis points.
This rate hike, the most significant since 1994, shows the Fed is concerned about inflation. The market has priced in another increase of 75 basis points for July, repeating the Fed's theme of being aggressive and making this rate increase a front-loaded one. September and November are each poised for increases of 50 basis points with another 25 basis points in December. The goal is to end the year with a 3.5% Federal Funds rate.
The likelihood of the U.S. economy slowing down and falling into a recession is growing. Loretta Mester (President and CEO, Federal Reserve Bank of Cleveland) talked about recession risks rising because of monetary policy. As the Fed commits to taming inflation and the real GDP forecast for the year lowers, recession probabilities are moving closer to an ETA of Quarter 4, 2022. Furthermore, Treasury Secretary Janet Yellen commented that “unlikely high” prices and a slowdown in the U.S. economy are here to stay.
On the positive side, U.S. consumers and corporations are strong. The Federal Reserve Chair proclaimed that there is “no sign” of a broader slowdown. Recession probabilities — implied by the yield curve (inversion) 3 month/18 month forward spread, 2 year/10 year and 3 month/10 years — have decreased since March, largely led by higher rates in the long end (which is a reflection of the yield curve). Corporate yields have risen but spreads haven’t blown out. This shows that the market is pricing a policy error but not a recession. At least not yet.
The financial market, dwindling retirement accounts, and the rising cost of living make consumers feel otherwise.
CHANGES IN RATES
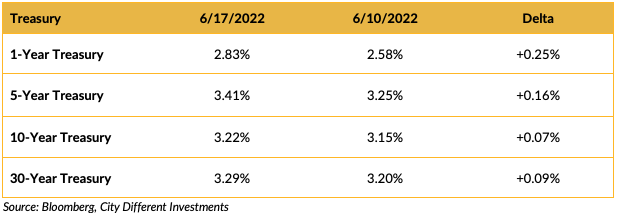
Rates in the Treasury market moved higher last week.
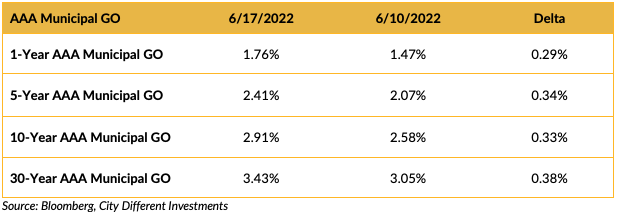
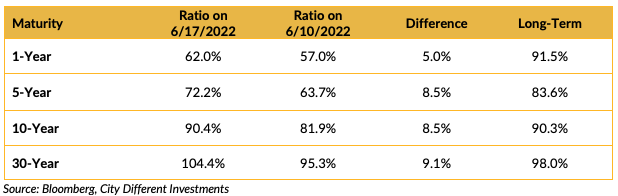
Rates in the municipal market increased across the board. The curve steepened with rates rising in the long end. Muni-Treasury ratios have moved a lot this week, with long end ratios starting to look like their long-term trends.
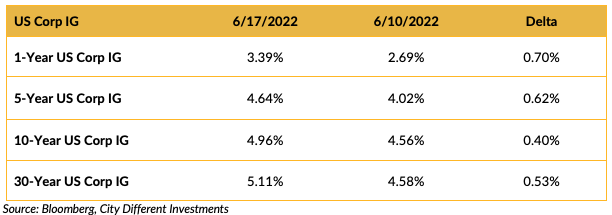
Investment-grade rates were higher last week following the Treasury market’s lead. Notice the big move in week-over-week change in rates.
THIS WEEK IN WASHINGTON
.png?width=1920&name=graphs%20in%20order%20(1).png)
In this week’s review on Washington, let’s discuss if monetary policy will cost Biden a second term.
Pollsters and political pundits seem to agree: yes. There is no doubt that soaring gas and grocery prices are hurting consumers (aka voters). All parties across the board are pricing in a downturn. A recession, which once seemed like a longshot, is very much becoming a potential reality. The blame has to go somewhere.
For the midterm elections in November, where the Democrats risk losing the Congress, the number one issue is rising prices. Declining consumer sentiment and Biden’s own falling approval rating mixed in with high inflation rates are bad indicators for Democrats this fall. However, gridlock in Congress often bodes well for the markets.
In other news, Biden is also grappling with an unstable geopolitical environment (Historically, this has helped incumbent presidents). The U.S.-China relationship is a tenuous one. But the U.S. has a new relationship to worry about: the Russia-China alliance. The U.S. has rejected China’s claims over the Taiwan Strait. This issue demands close watching. If the U.S. gets into a skirmish with China, this would be a major setback for the U.S. economy.
WHAT, ME WORRY ABOUT INFLATION?
.png?width=800&name=graphs%20in%20order%20(2).png)
The 5-year Breakeven Inflation Rate ended the week at 2.36%, down 3 basis points from last week's 2.39%. The 10-year Breakeven Inflation Rate was 2.74% at week's end, up 2 basis points lower from the prior week's 2.76%.
MUNICIPAL CREDIT
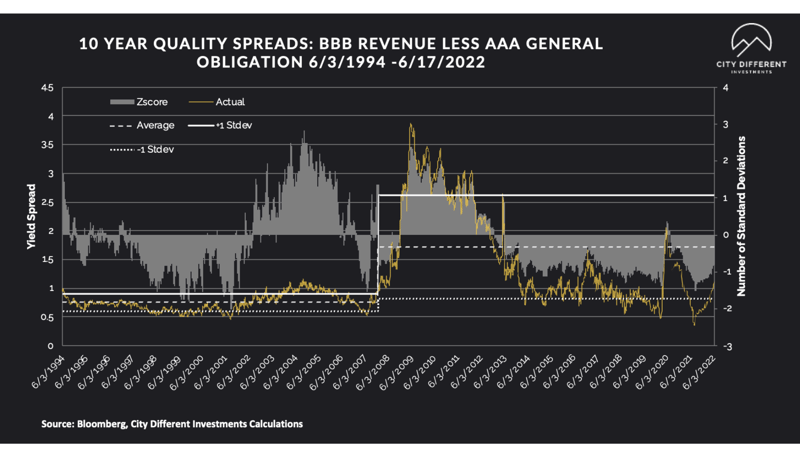
While we saw an increase in rates, credit spreads remained steady.
WHY IS THE MUNICIPAL MARKET BEHAVING THIS WAY?
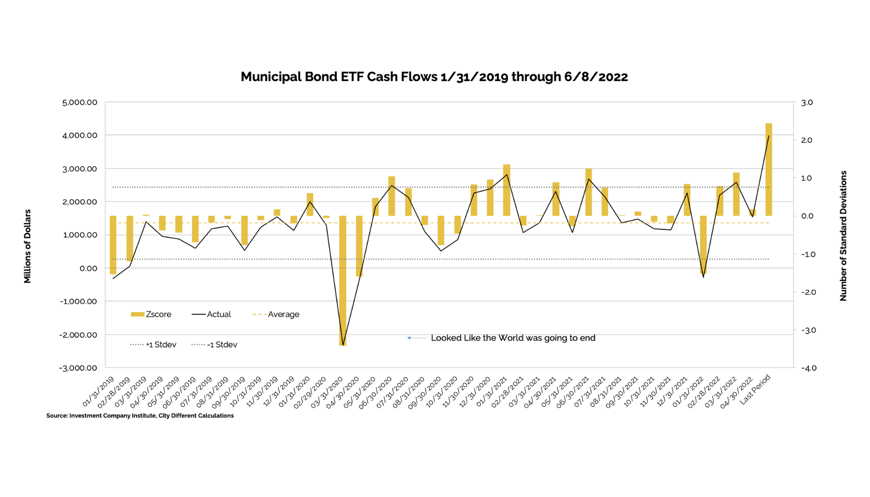
Various sources are used to report cash flows into municipal bond mutual funds and ETFs, all reporting at different times. The source we have chosen to use is the Investment Company Institute (I.C.I.). The I.C.I. reported weekly cash flows from municipal bond mutual funds for the week of 6/8/2022 as -$2.2 billion, lower than last week’s positive $1.1 billion from the week before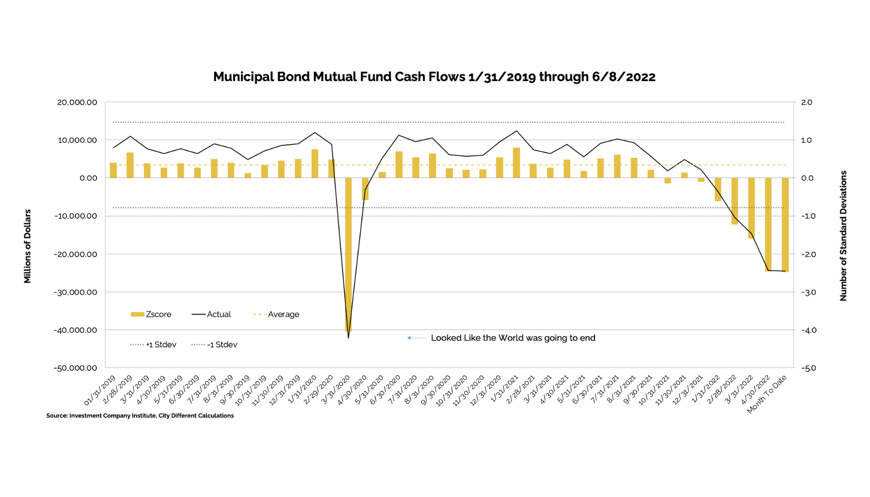
Cash flows into municipal bond ETFs for the same period were -$398 million, compared to +$817 million the prior week.
TAXABLE VS. TAX-EXEMPT MUNICIPAL BONDS
The implied tax rate for a taxable vs. a tax-exempt A.A. municipal bond in various maturities is as follows:
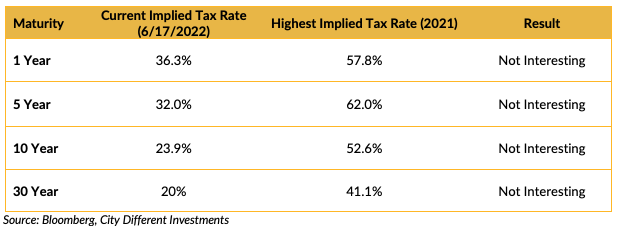
Municipal bonds have given back some of the rally that they experienced a week ago, catching up to their taxable counterparts.
SUPPLY OF NEW ISSUE MUNICIPAL BONDS
In its Municipal Markets Weekly newsletter, JP Morgan commented on the supply picture this week, stating that:
“(For the week of June 20), we expect total supply of $6.7 billion, or 60% of the 5-year equivalent average ($11.1 billion). We anticipate tax-exempt supply of $5.8 billion (67% of average), and taxable/corp cusip supply of $0.9 billion (36% of average).”
The supply picture does not get interesting until it exceeds $10 billion tax-exempt issuances in a given week.
CORPORATE INVESTMENT GRADE AND HIGH YIELD OVERVIEW
In U.S. investment grade land, new issue activity has petered out as the fixed income market digests the volatility.
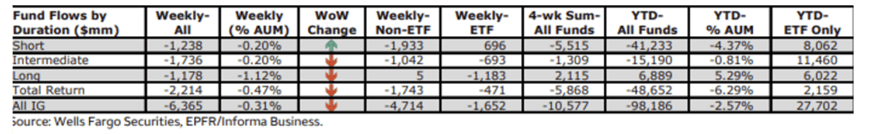
In its weekly "Credit Flows" report, Wells Fargo commented:
"IG fund flows more than tripled, with $6.4 billion in outflows, the second-largest weekly drawdown both YTD (-$7.7 billions through May 11) and since March 2020. Since December 1, flows have been negative in all but four weeks, with cumulative net outflows of $102.5 billion over that period (-$98 billion YTD). Below is an IG Flows table by investment strategy. Please note that short duration is the only strategy to see fund inflows."
CONCLUSION
In their meeting last week, the Federal Reserve delivered a 75-bps rate increase; a move that shook the financial market.
The Fed’s rapidity and aggressiveness toward tackling inflation now points to a slowdown in the economy and a rapidly approaching recession scenario.
As prices increase and recession looms, Biden’s approval rating plummets — and with it so do the Democrats’ chances in November’s midterm election.
IMPORTANT DISCLOSURES
The information and statistics contained in this report have been obtained from sources we believe to be reliable but cannot be guaranteed. Any projections, market outlooks or estimates presented herein are forward-looking statements and are based upon certain assumptions. Other events that were not taken into account may occur and may significantly affect the returns or performance of these investments. Any projections, outlooks or assumptions should not be construed to be indicative of the actual events which will occur. These projections, market outlooks or estimates are subject to change without notice.
Please remember that past performance may not be indicative of future results. Different types of investments involve varying degrees of risk, and there can be no assurance that the future performance of any specific investment, investment strategy, or product or any non-investment related content, made reference to directly or indirectly herein will be profitable, equal any corresponding indicated historical performance level(s), be suitable for your portfolio or individual situation, or prove successful. Due to various factors, including changing market conditions and/or applicable laws, the content may no longer be reflective of current opinions or positions.
All indexes are unmanaged, and you cannot invest directly in an index. Index returns do not include fees or expenses. Actual portfolio returns may vary due to the timing of portfolio inception and/or investor-imposed restrictions or guidelines. Actual investor portfolio returns would be reduced by any applicable investment advisory fees and other expenses incurred in the management of an advisory account.
You should not assume that any discussion or information contained herein serves as the receipt of, or as a substitute for, personalized investment advice from City Different Investments. To the extent that a reader has any questions regarding the applicability above to his/her individual situation or any specific issue discussed, he/she is encouraged to consult with the professional advisor of his/her choosing. City Different Investments is neither a law firm nor a certified public accounting firm and no portion of this content should be construed as legal or accounting advice.
A copy of City Different Investments' current written disclosure statement discussing our advisory services and fees is available for review upon request.
Unless otherwise noted, City Different Investments is the source of information presented herein.
A description of the indices mentioned herein are available upon request.