.png)

WEEK ENDING 4/28/2023
Highlights of the week:
- First Republic Bank is circling the bowl.
- Inflation is sticky! Unemployment is rising! Growth is slowing!
- Are stagflation risks increasing?
A CITY DIFFERENT TAKE
The results of the auction of First Republic Bank were announced Sunday night. The seizure of First Republic and the collapse of Silicon Valley Bank are related in that both represent the same idiosyncratic risks and bad risk-management decisions — not systemic risks to the whole banking system. The Wall Street Journal reported Monday morning, “First Republic Bank is Seized and Sold to JP Morgan”.
“The deal will see JPMorgan take on all of First Republic’s $103.9 billion in deposits and buy most of its $229.1 billion in assets. First Republic shares sank to less than $2 premarket.”
This is not 2007/2008 all over again! But this third bank takeover may aid the Fed in its job to achieve its 2.00% inflation target. Bank loans should be harder to get.
The fixed income markets are awaiting next week's decision from the Federal Reserve on short-term interest rates. Market expectations are for a 25-basis-point increase, but the statement should shed more light on the future path of rates. Thursday and Friday’s economic releases gave the Fed and the fixed income markets support for both bull and bear scenarios. On the bull side, initial jobless claims and continuing claims are on the rise. Seasonally adjusted initial jobless claims have exceeded 200,000 for the last four weeks. Continuing jobless claims have exceeded 1.8 million for the period from March 24 to April 14. Gross domestic product annualized quarter-over-quarter did not meet market expectations (1.1% vs 1.9%) and represented a decrease from last quarter's 2.6%. Finally, the government takeover of another regional bank should put downward pressure on loan growth.
On the bearish side, the Q1 employment cost index exceeded market expectations (1.2% vs. 1.1%), and last quarter's reading was revised upward to 1.1%. Inflation, as measured by the year-over-year Core Personal Consumption Expenditure Price Index, came in at 4.6%, right along with market expectations and in line with last month's unrevised reading. (That reading was revised by +0.1% to 4.7%.) So, in summary, joblessness seems to be increasing (next Friday’s releases should give a better picture), employment costs are on the rise, and inflation looks sticky.
Why is inflation sticky? Milton Friedman said, “Inflation is always and everywhere a monetary phenomenon, in the sense that it is and can be produced only by a more rapid increase in the quantity of money than in output.” So, let’s look at money supply as measured by M2.
We need two measurements to explain inflation: M2 (last measured on March 1) and the velocity of M2 (last measured on January 1).
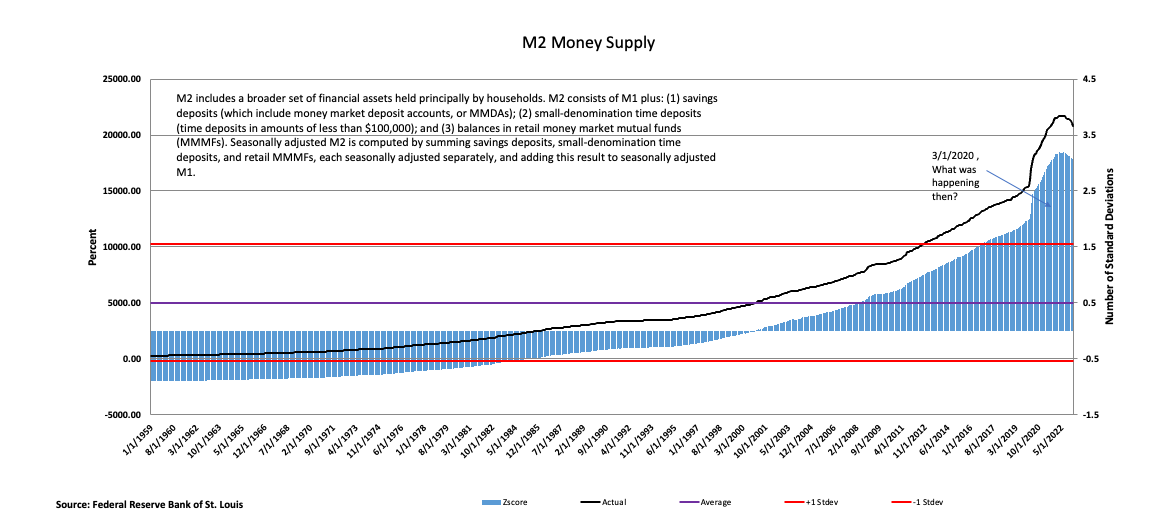
M2 is declining, but there is still a lot of money in the system, as measured by historical standards going back to January of 1959.
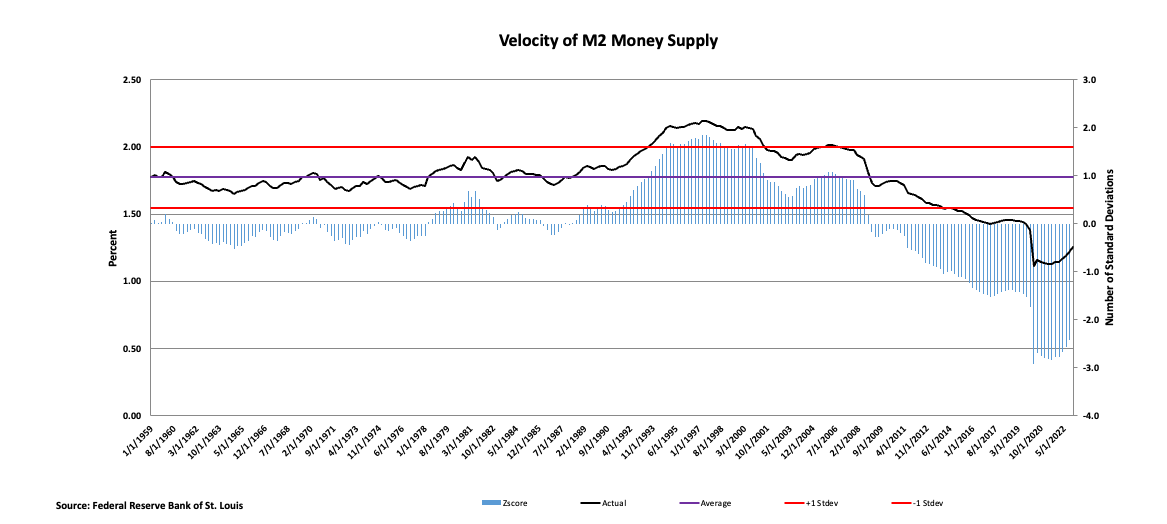
At the same time that M2 is declining, the velocity of M2 is increasing, albeit slightly. To be fair, the velocity of M2 has been at historic lows for some time — almost as long as the supply of M2 outstanding has been above historic norms.
Inflation looks sticky, unemployment seems to be rising, and growth is slowing. This sounds like a formula for something. Yeah, that would be stagflation. The Fed’s job is getting harder indeed!
CHANGES IN RATES
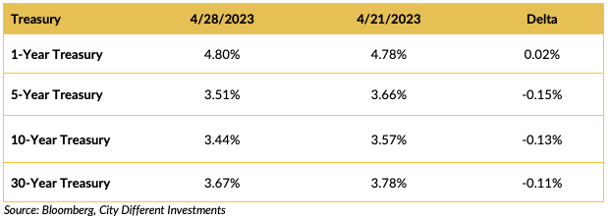
Yields in the Treasury market moved lower for maturities longer than one year. The slope of the 1-to-30-year yield curve moved deeper into negative territory, from -1.00% on April 21 to -1.13% on April 28.
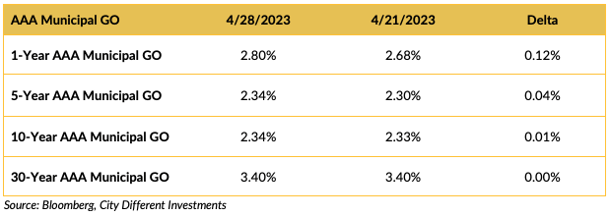
Yields in the municipal market were essentially unchanged for the week. This represents a further adjustment from very rich levels.
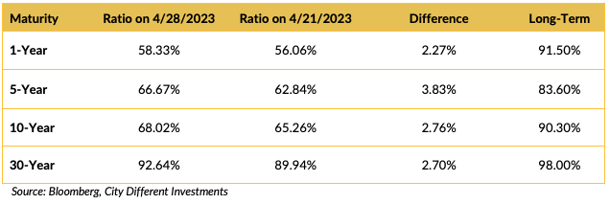
Municipal ratios are still low compared to long-term averages but are moving in the right direction.
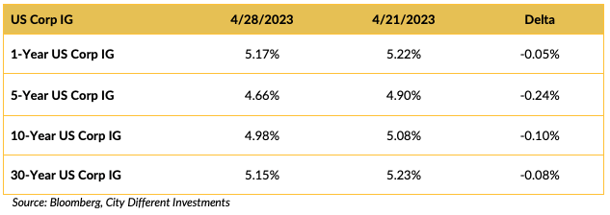
Yield in the investment grade (IG) corporate market moved lower on the week.
THIS WEEK IN WASHINGTON
.png?width=1920&name=graphs%20in%20order%20(1).png)
President Biden announced he is running for a second term.
Speaker McCarthy passed his debt ceiling/spending cut bill in the House. By all reports, it is D.O.A. in the Senate, and President Biden refuses to sign it if passed. Oh, what a fine mess this is. Could another debt ceiling crisis be on the way?
First Republic Bank looks to be in its last throes of life. Saturday morning, Bloomberg ran the headline “FDIC Asks JPMorgan, PNC for First Republic Bids Due Sunday.”
As we now know, JPMorgan is the “lucky” buyer following the FDIC seizure.
WHAT, ME WORRY ABOUT INFLATION?
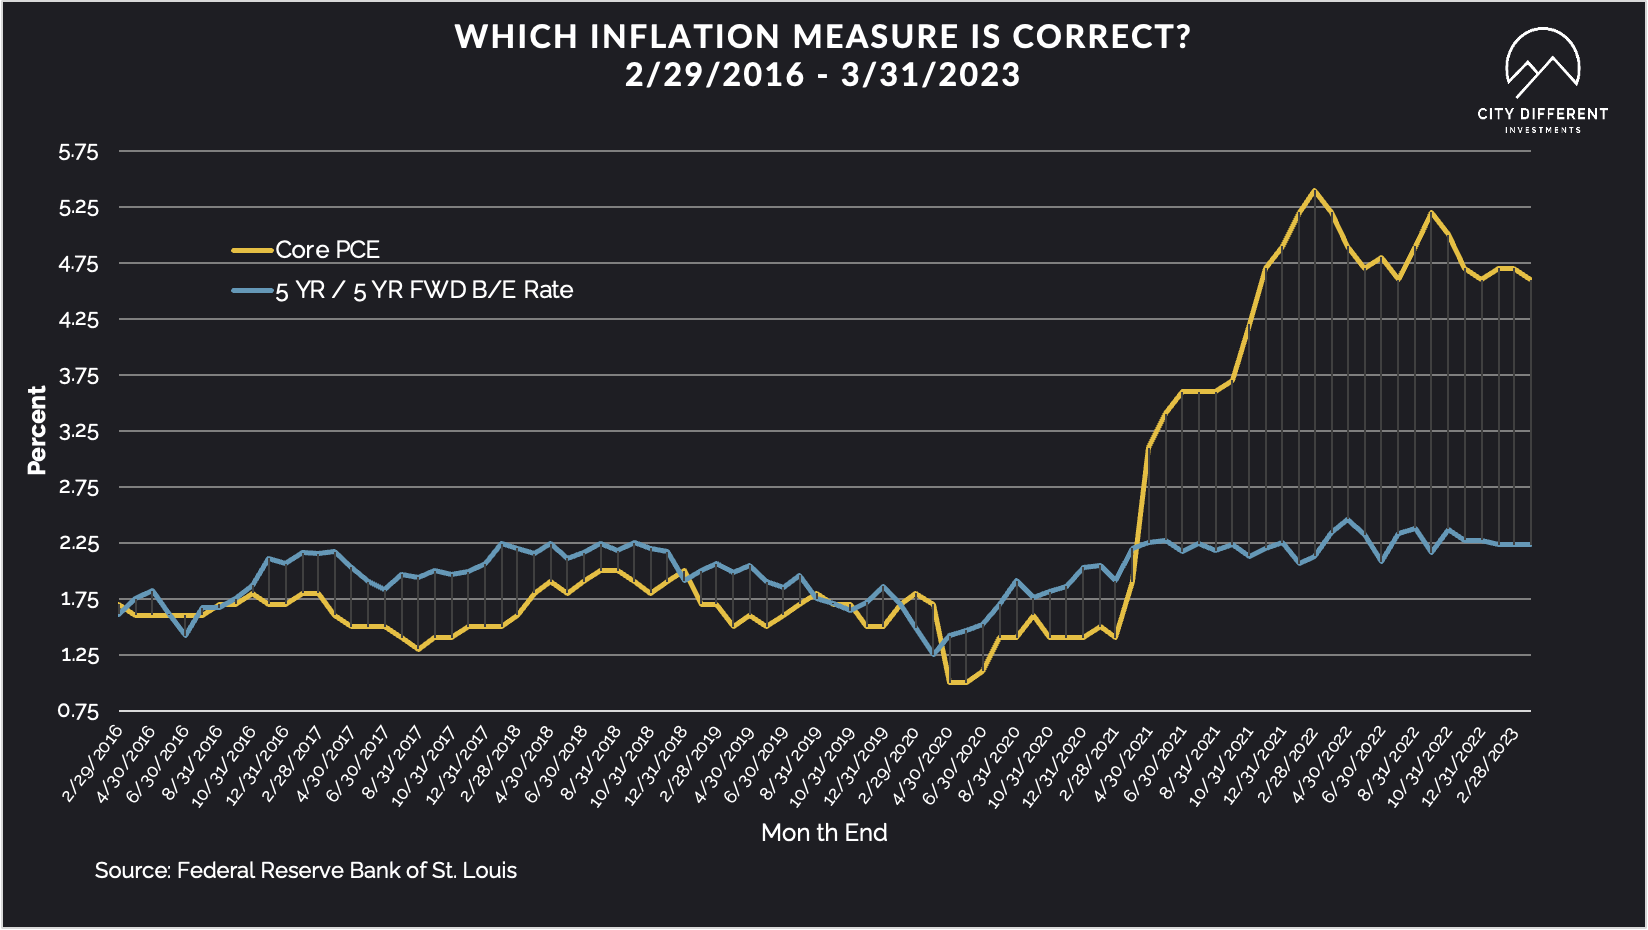
The 5-year Breakeven Inflation Rate ended the week at 2.16%, 10 basis points lower than the April 21 closing of 2.26%. The 10-year Breakeven Inflation Rate ended the week at 2.18%, also 10 basis points lower than last week’s observation of 2.28%
We had another inflation reading release last week: the Personal Consumption Expenditure Index (PCE). Core year-over-year PCE was 4.6% in March, in line with the unrevised February reading (but later revised up to 4.7%). Inflation, as measured by core PCE, looks sticky (a Fed fear).
MUNICIPAL CREDIT
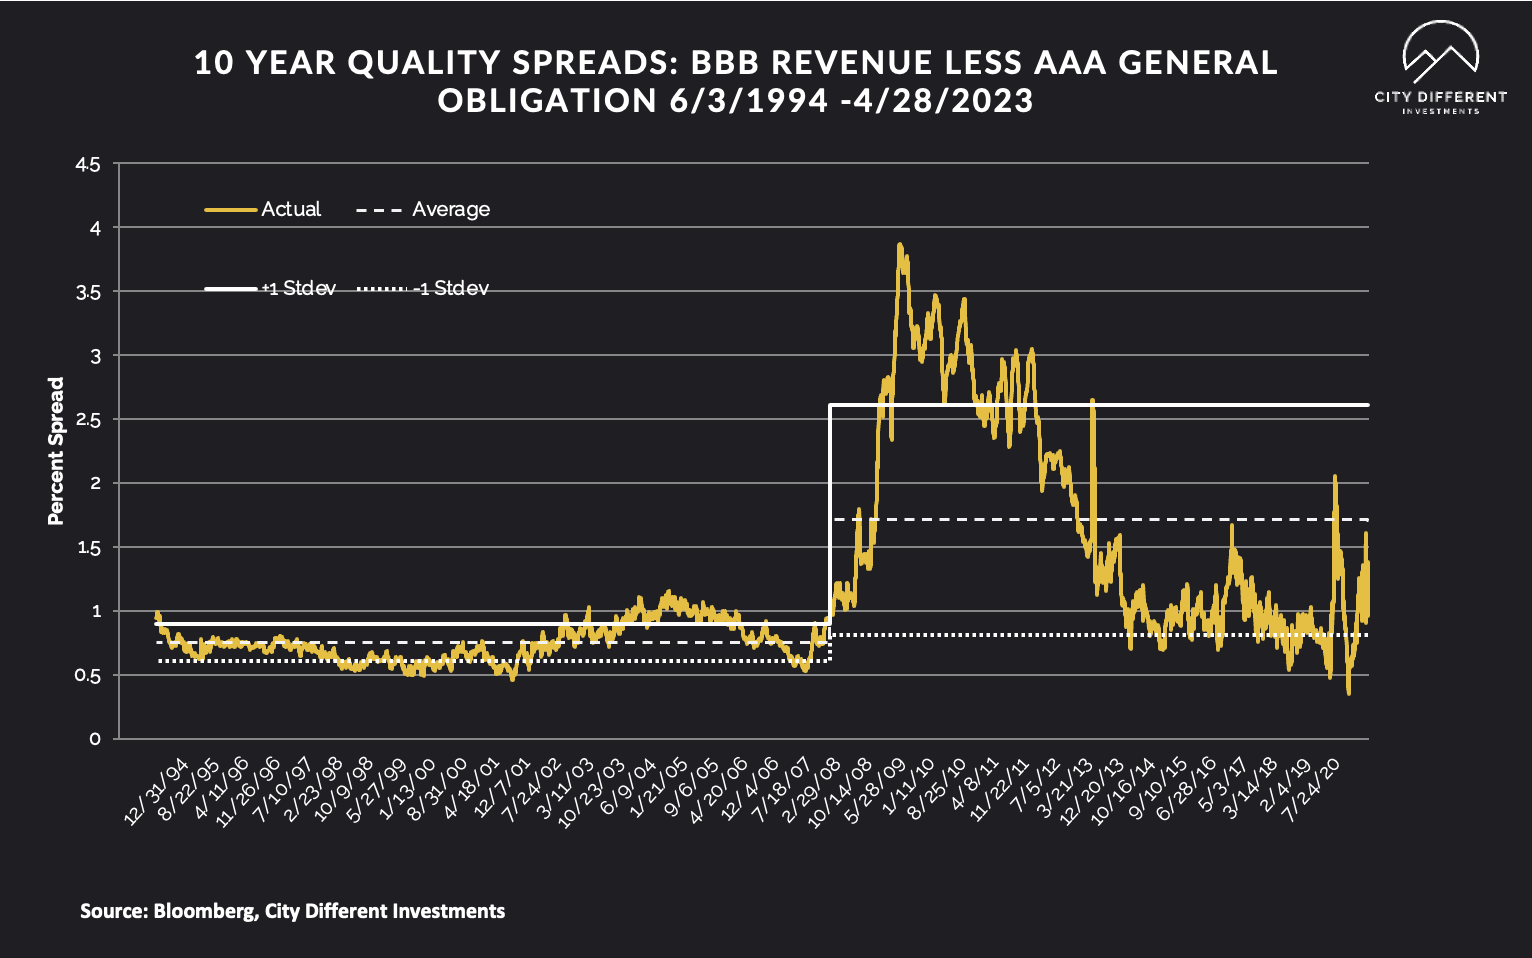
Most of the action was contained on the rates side for the municipal market. 10-year quality spreads (AAA vs. BBB) as of April 28 at 1.38% (based on our calculations), 0.08% higher than last week’s 1.30%. The long-term average is 1.71%. By our way of thinking, lower-quality securities are still not attractive but are moving in the right direction.
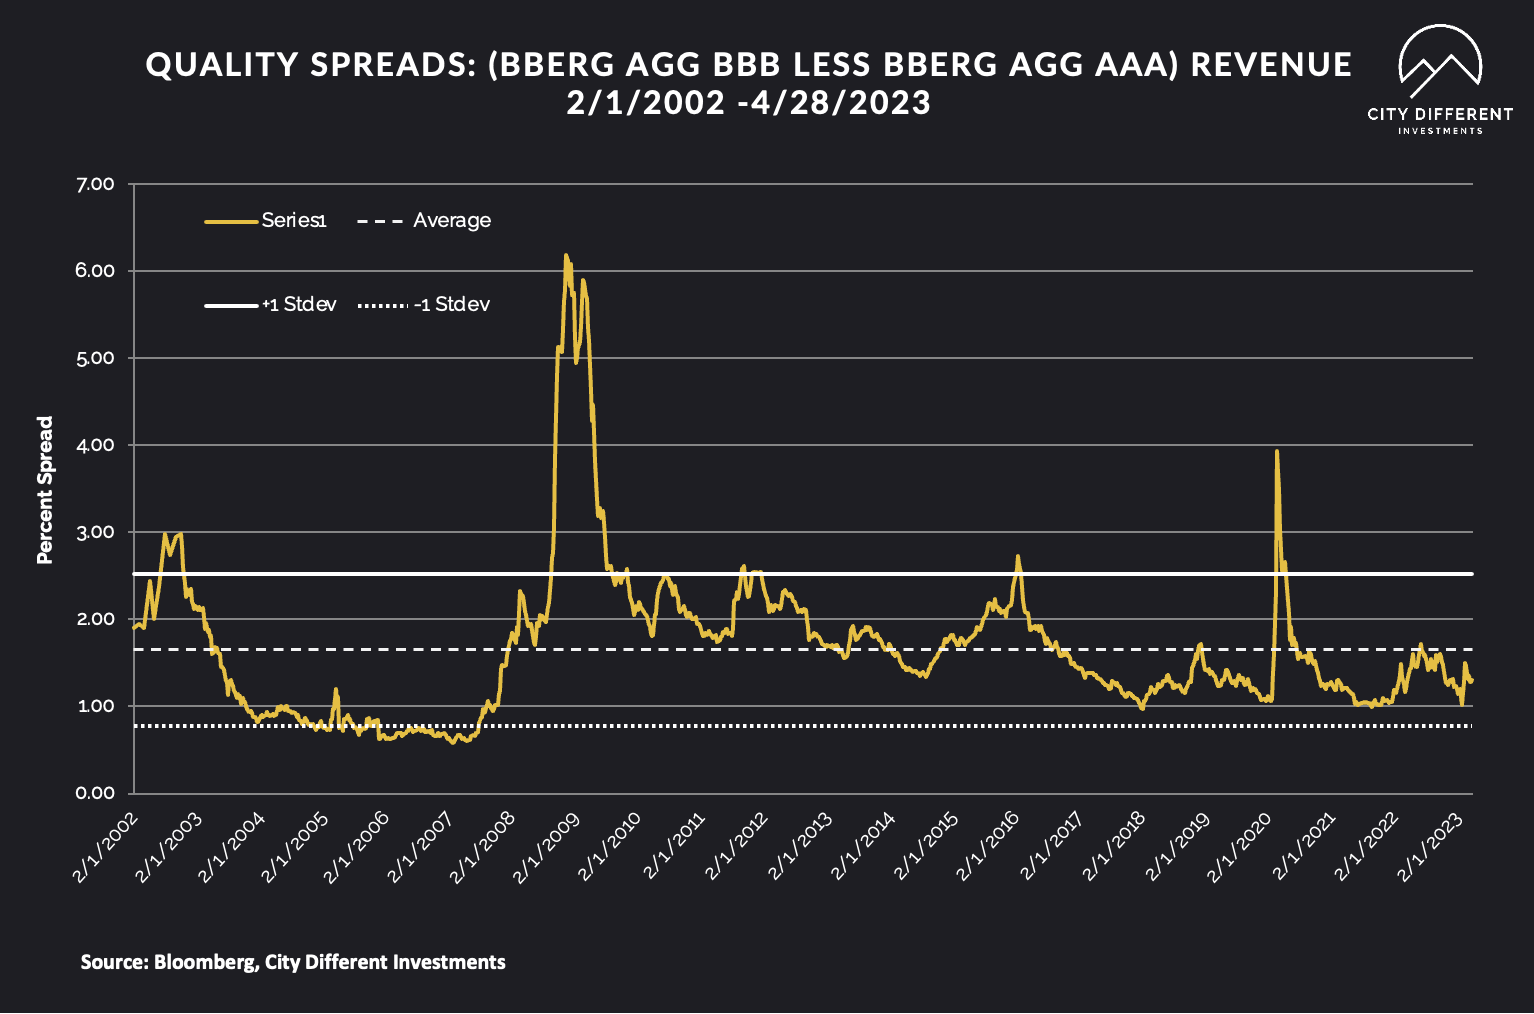
Quality spreads in the taxable market are not attractive but are moving in the right direction, ending the week at 1.30%.
WHERE ARE FIXED-INCOME INVESTORS PUTTING THEIR CASH?
Money Market Flows (millions of dollars)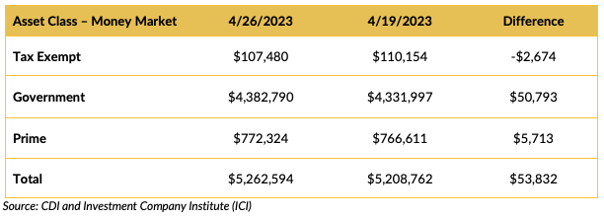
Tax-exempt money market funds saw negative cash flows last week, no doubt due to the expensive ratios (see above) — especially government money market funds. Government and prime money market funds saw positive flows last week. Investors must like the safety and the yield offered by these low-risk instruments.
Mutual Fund Flows (millions of dollars)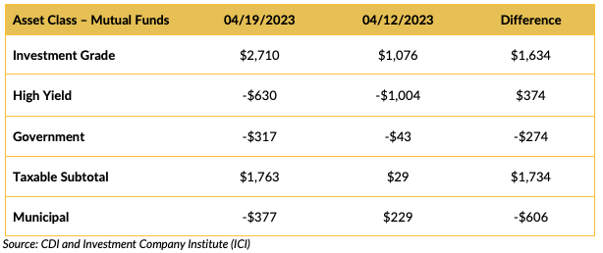
Flows into bond funds were mixed last week. Taken on the whole, bond funds saw $1.4 (B) positive inflows, most of that was powered by investment-grade funds.
ETF Fund Flows (millions of dollars)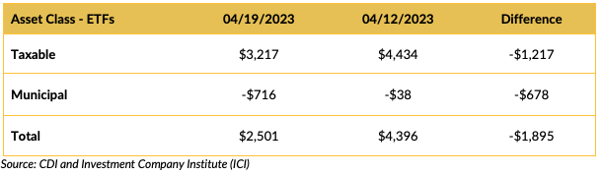
ETFs saw positive flows into them but at a slower pace than the week before.
SUPPLY OF NEW ISSUE MUNICIPAL BONDS
This week’s supply is projected to be modest, slated somewhere around $6.4 billion.
CONCLUSION
The Fed’s job is getting tougher. The next year will also be tough for investors as volatility increases and the tug-of-war between inflation and growth plays out.
IMPORTANT DISCLOSURES
The information and statistics contained in this report have been obtained from sources we believe to be reliable but cannot be guaranteed. Any projections, market outlooks or estimates presented herein are forward-looking statements and are based upon certain assumptions. Other events that were not taken into account may occur and may significantly affect the returns or performance of these investments. Any projections, outlooks or assumptions should not be construed to be indicative of the actual events which will occur. These projections, market outlooks or estimates are subject to change without notice.
Please remember that past performance may not be indicative of future results. Different types of investments involve varying degrees of risk, and there can be no assurance that the future performance of any specific investment, investment strategy, or product or any non-investment related content, made reference to directly or indirectly herein will be profitable, equal any corresponding indicated historical performance level(s), be suitable for your portfolio or individual situation, or prove successful. Due to various factors, including changing market conditions and/or applicable laws, the content may no longer be reflective of current opinions or positions.
All indexes are unmanaged, and you cannot invest directly in an index. Index returns do not include fees or expenses. Actual portfolio returns may vary due to the timing of portfolio inception and/or investor-imposed restrictions or guidelines. Actual investor portfolio returns would be reduced by any applicable investment advisory fees and other expenses incurred in the management of an advisory account.
You should not assume that any discussion or information contained herein serves as the receipt of, or as a substitute for, personalized investment advice from City Different Investments. To the extent that a reader has any questions regarding the applicability above to his/her individual situation or any specific issue discussed, he/she is encouraged to consult with the professional advisor of his/her choosing. City Different Investments is neither a law firm nor a certified public accounting firm and no portion of this content should be construed as legal or accounting advice.
A copy of City Different Investments' current written disclosure statement discussing our advisory services and fees is available for review upon request.
Unless otherwise noted, City Different Investments is the source of information presented herein.
A description of the indices mentioned herein are available upon request.