

WEEK ENDING 4/6/2023
Highlights of the week:
- Inflation may be slowing but is still above the Federal Reserve’s target of 2%.
- Will inflation prove sticky, forcing the Fed to change its target and declare victory?
- Are the risks of stagflations markedly increasing?
A CITY DIFFERENT TAKE
Last week was rife with market-moving economic data releases. On Monday, the U.S. ISM Manufacturing Prices Paid Index was at 49.2, down from 51.3 the prior month and missing expectations of 51.1. According to Investopedia:
“A PMI above 50 indicates an expansion of the manufacturing segment of the economy compared to the previous month. A reading of 50 means no change. A reading below 50 suggests a contraction.”
Next came employment numbers. On Tuesday, the Job Openings and Labor Turnover Survey (JOLTS) Job Openings report showed that 9.9 million jobs are still unfilled in the economy. The Barron’s article “The Fed’s Inflation Fight Didn’t Get Much Help From the Decent Jobs Report” reported that “February showed fewer than 10 million unfilled positions for the first time since May 2021. But there were still 1.67 job openings for each unemployed person.”
Thursday’s release of initial jobless claims was a little higher than expected (228,000 vs. 200,000) but lower than the revised number of the previous reading (246,000). The continuing claims number (1,823,000) was above expectations (1,700,000) and in line with a revised previous reading of 1,817,000.
These releases set the stage for Friday’s unemployment report. The unemployment rate dropped to 3.5%, 0.1% lower than the previous month’s 3.6%. Average hourly earnings were down year-over-year, 4.2% versus 4.6%.
In light of all this data, according to Barron's Take on Jobs,
“Ultimately, the March employment report did little to settle the standoff between the Fed and the interest-rate markets. Fed Chairman Jerome Powell & Co. are sticking to their script of one more interest-rate hike, to a median rate of 5.1% by year end.
The markets expect rate cuts starting as early as July, with three reductions to a range of 4.25%-4.50% by December, to counter what they see as a sliding economy ahead of an election year in 2024. In which case, we could be faced with stagflation, should prices and wages remain sticky even after the Fed’s series of sharp rate increases.”
These releases showed a decline in these key inflation factors but not enough of a decline to support the Fed’s 2% inflation target. If the Fed gets the inflation rate down to 3%, will they declare victory?
If so, then the 10-year real yield on a current 10-year Treasury yielding 3.39% would be +0.391%, well below the historical average of 1.94% (a -0.88 standard deviation event for those keeping score). The same analyses using the current 5-year Treasury shows a real yield of 0.497%, a long-term average of 1.42% (a -0.497 standard deviation event).
This week we get our first glimpses at new inflation data.
CHANGES IN RATES
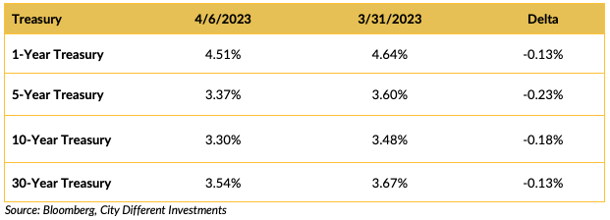
It was another volatile week in the fixed-income markets. Interest rates decreased more than indicated above through Thursday, but Friday's jobs report gave the bond bulls a moment of pause. The BofA Move index is the best depiction of the fixed-income markets' volatility over the last year:
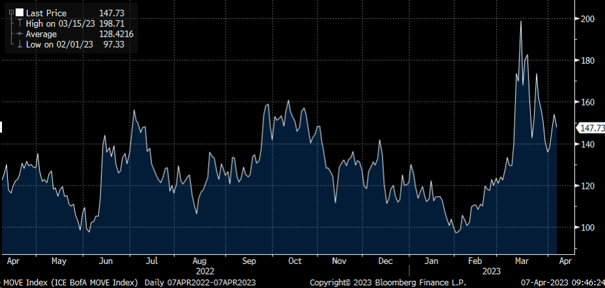
As you can see, the last reading is 15% above the one-year average reading, which is a 1.15 standard deviation event for those keeping score.
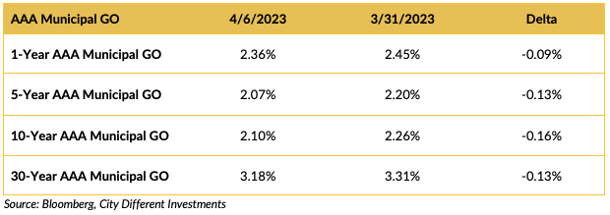
The municipal market followed the Treasury market into lower in yields.
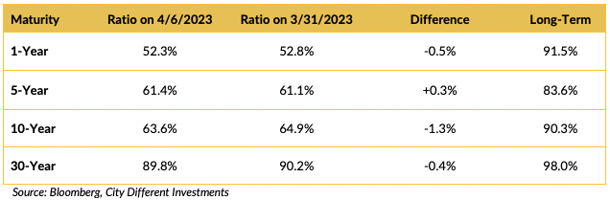
Relative to the Treasury market, municipal bonds moved in line as the ratios indicate.
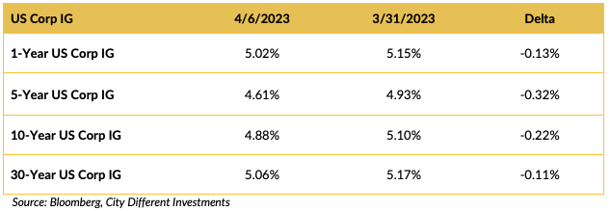
Yield in the investment grade (IG) corporate market moved lower on the week.
THIS WEEK IN WASHINGTON
.png?width=1920&name=graphs%20in%20order%20(1).png)
This was a quiet week on the Washington front as all the big news was happening in New York City.
The first lady caused a little stir by suggesting that both teams in the women's NCAA basketball final celebrate at the White House. This grabbed headlines for a day or so.
The Jim Jordan-led House Judiciary Committee subpoenaed former New York County Special Assistant District Attorney Mark Pomerantz for his role in the New York imbroglio. What type of response does Mr. Jordan expect after he ignored subpoenas and refused to answer questions from the January 6 committee? I guess in the House, it’s “do as I say, not as I do.”
Finally, a 12-page report by the National Security Council on the withdrawal from Afghanistan was released. The NBC news headline read:
“Biden White House largely blames Trump admin for troubled U.S. troop withdrawal from Afghanistan.”
We are “shocked, shocked, we say” to discover the last administration is blamed for what can only be called a dumpster fire of an operation. We were almost as shocked to find out there was gambling at Rick’s Café.
WHAT, ME WORRY ABOUT INFLATION?
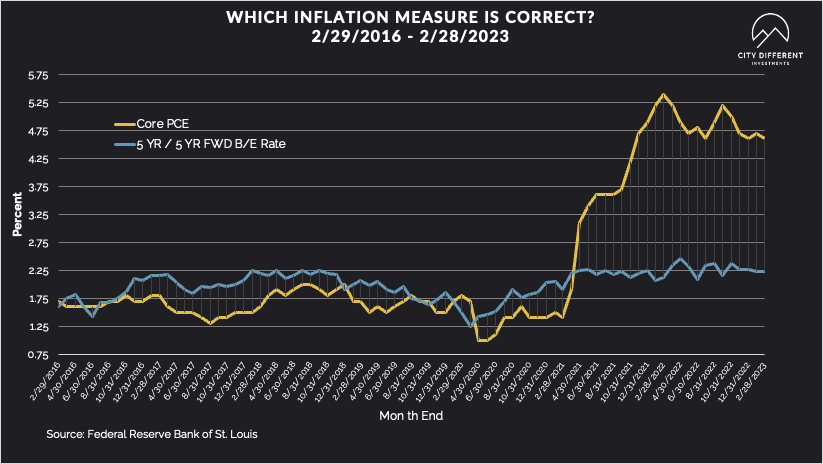
The 5-year Breakeven Inflation Rate ended Thursday at 2.17%, 7 basis points lower than the March 31 closing of 2.24%. The 10-year Breakeven Inflation Rate ended the week at 2.24%, 8 basis points lower than last week’s observation of 2.32%.
MUNICIPAL CREDIT
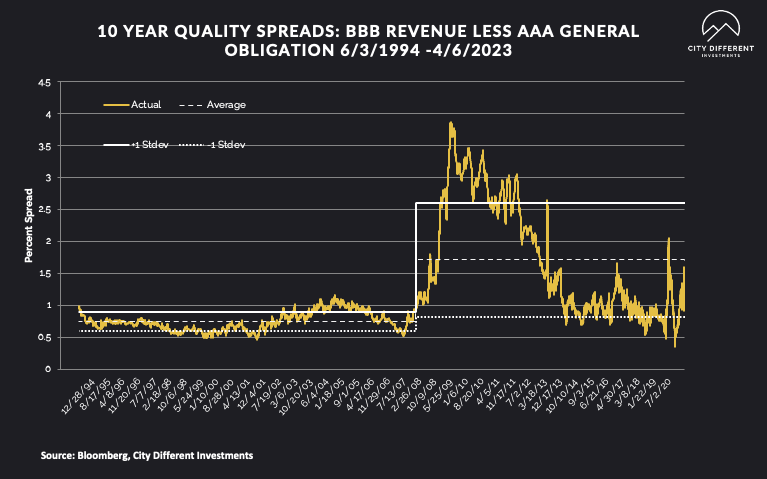
10-year quality spreads (AAA vs. BBB) were unchanged on the week from 1.21% to 1.28% (based on our calculations). The long-term average is 1.71%. By our way of thinking, lower quality securities are still not attractive.
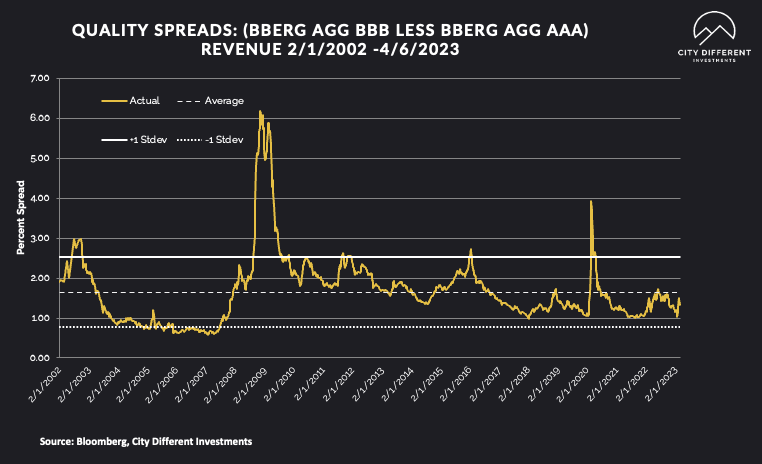
Quality spreads in the taxable market were unchanged on the week, ending at 1.35%.
WHERE ARE FIXED-INCOME INVESTORS PUTTING THEIR CASH?
Money Market Flows (millions of dollars)
Money market funds saw positive cash flows last week, especially government money market funds. It looks like cash is no longer trash!
Mutual Fund Flows (millions of dollars)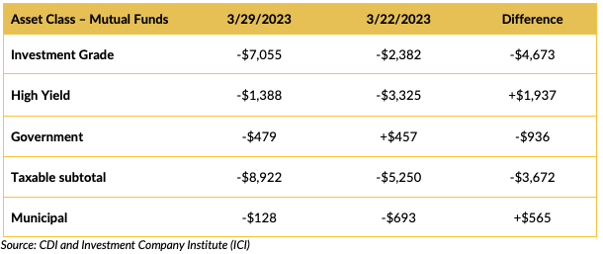
It looks like no one liked bonds last week. Can you blame them? Negative cash flow into municipal bond mutual funds, while still negative, slowed a bit.
ETF Fund Flows (millions of dollars)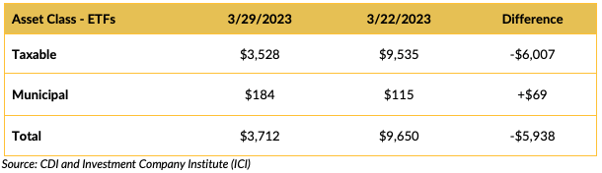
Other services that track mutual fund cash flows have reported slight inflows for municipal bond mutual funds for the week ending April 5.
SUPPLY OF NEW ISSUE MUNICIPAL BONDS
Estimates for next week’s new issue supply will be around $8.5 billion.
Total new issuance supply figures of $10 billion or more usually indicate weakness in new issue supply pricing (higher yields).
CONCLUSION
Based on recent data, we still believe that we can build both a bullish and a bearish outlook for bonds (we’ve felt this way for a while). With this in mind, we are positioning our clients’ accounts within the neutral range of their relative duration targets.
IMPORTANT DISCLOSURES
The information and statistics contained in this report have been obtained from sources we believe to be reliable but cannot be guaranteed. Any projections, market outlooks or estimates presented herein are forward-looking statements and are based upon certain assumptions. Other events that were not taken into account may occur and may significantly affect the returns or performance of these investments. Any projections, outlooks or assumptions should not be construed to be indicative of the actual events which will occur. These projections, market outlooks or estimates are subject to change without notice.
Please remember that past performance may not be indicative of future results. Different types of investments involve varying degrees of risk, and there can be no assurance that the future performance of any specific investment, investment strategy, or product or any non-investment related content, made reference to directly or indirectly herein will be profitable, equal any corresponding indicated historical performance level(s), be suitable for your portfolio or individual situation, or prove successful. Due to various factors, including changing market conditions and/or applicable laws, the content may no longer be reflective of current opinions or positions.
All indexes are unmanaged, and you cannot invest directly in an index. Index returns do not include fees or expenses. Actual portfolio returns may vary due to the timing of portfolio inception and/or investor-imposed restrictions or guidelines. Actual investor portfolio returns would be reduced by any applicable investment advisory fees and other expenses incurred in the management of an advisory account.
You should not assume that any discussion or information contained herein serves as the receipt of, or as a substitute for, personalized investment advice from City Different Investments. To the extent that a reader has any questions regarding the applicability above to his/her individual situation or any specific issue discussed, he/she is encouraged to consult with the professional advisor of his/her choosing. City Different Investments is neither a law firm nor a certified public accounting firm and no portion of this content should be construed as legal or accounting advice.
A copy of City Different Investments' current written disclosure statement discussing our advisory services and fees is available for review upon request.
Unless otherwise noted, City Different Investments is the source of information presented herein.
A description of the indices mentioned herein are available upon request.