

WEEK ENDING 2/3/2023
Highlights of the week:
- The Fed raised its targeted short-term rate by 0.25%. Chairman Powell’s message has been consistent since his Jackson Hole speech last summer. Why does the market doubt him?
- The blowout employment report coupled with a strong JOLTS report doesn’t seem recessionary.
- Debt ceiling negotiations have begun. When was the last time D.C. solved a problem well before the brink of disaster?
- We can’t wait to see the behavior of attendees during Tuesday’s State of the Union address.
A CITY DIFFERENT TAKE
The Fed raised its targeted short-term rate by 0.25%. Chairman Powell has stayed consistent with the plan he outlined at Jackson Hole last summer. Why has the market doubted him and priced in an eminent recession? This could be one of the most widely anticipated recessions in our collective memory.
Friday’s employment report certainly put a dent into the recession theory. Nonfarm payrolls increased by 517,000 — 2.75x job growth expectations.
Our first reaction when seeing the release can't be printed here, so we will rely on a phrase Chris’s high school German teacher used: “um Gottes willen.” (Translation: “for goodness sake”) Though, to be fair, that was usually followed by “Herr Ryon, du bist ein esel.” (Translation: “Mr. Ryon, you are as suborn as a donkey.”)
Friday’s report included the unemployment rate dropping to 3.4% (a rate not seen since 1969). Also, the average hourly earnings year over year declined to 4.4% from a revised December reading of 4.8%. When you couple these numbers with a JOLTS report showing more than 11 million job openings, the recession thesis seems less likely.
Debt ceiling negotiations began on Wednesday. President Biden’s opening salvo was made clear in the following exchange:
“Biden, asked by CNN what his message to McCarthy would be in that meeting, said it would be ‘show me your budget and I’ll show you mine.’”
The images conjured by this line are precious. We guess not much has changed since the playground.
CHANGES IN RATES
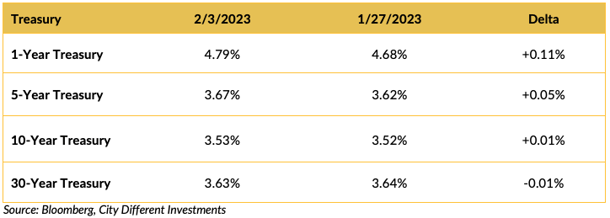
The week-on-week Treasury rate comparison hides the volatility the markets experienced last week. The 10-year Treasury reached a yield of 3.40% by Thursday’s close only to increase to 3.53% by Friday’s close — a 0.13% increase (after the jobs report, “um Gottes willen”).
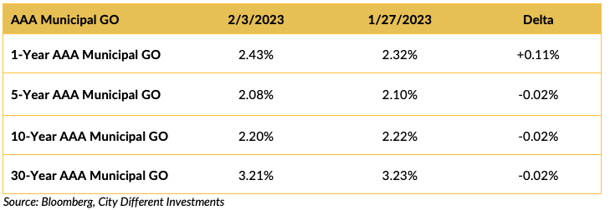
The municipal market did not process the new information in the same manner as the Treasury market. A 10-year AAA general obligation bond closed Thursday at 2.16% and finished Friday at 2.20%, for a 0.04% increase. A 30% relative rate of change versus the Treasury market. “Um Gottes willen,” for an entirely different reason.
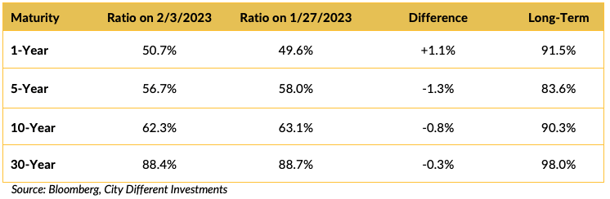
All quiet on the ratio front. No surprise.
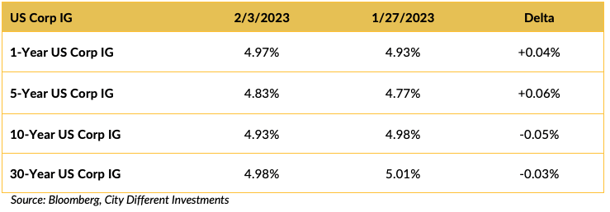
The week’s volatility was shared by the investment grade (IG) corporate market. Ten-year IG corporates closed Thursday at 4.78% and closed Friday at 4.93%, a 0.15% increase in that rate.
THIS WEEK IN WASHINGTON
.png?width=1920&name=graphs%20in%20order%20(1).png)
Debt ceiling negotiations began on Wednesday with a meeting between the Speaker of the House and President Biden. The initial comments of both participants appear to be positive, but who can believe that? We guess the real question is, whose budget is bigger?
Biden’s State of the Union address is scheduled for Tuesday. Do you think any Chinese balloons will hover over D.C. in search of intelligence? We doubt it. All the side bets are on which House member will reprise Joe Wilson’s “you lie” incident.
WHAT, ME WORRY ABOUT INFLATION?
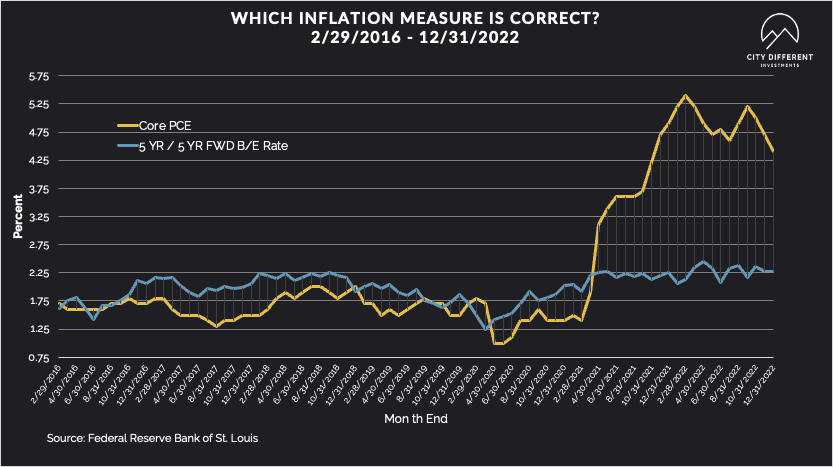
The 5-year Breakeven Inflation Rate ended Friday at 2.17%, 16 basis points lower than the January 27 closing of 2.33%. The 10-year Breakeven Inflation Rate ended the week at 2.22%, 11 basis points lower than the January 27 observation of 2.33%.
MUNICIPAL CREDIT
There were several credit-specific headlines on Bloomberg last week:
- American Dream Mall Skips Second Payment on NJ Grant-Backed Debt
To illustrate a clear disparity in pricing, CUSIP 74446HAD1, 7.00% of 12/1/2050, $4 Million traded on 1/12/2023 at a market of 87.398 / 87.148 (8.176 / 8.15) – seems like a sophisticated investor trade. But a poor unsuspecting investor traded $200,000 on 11/22/2022 at a market of 55 / 55 (13.045 / 13.045). Margaret Thatcher would say, “This is no time to go wobbly.”
- Puerto Rico Utility Fight Poses Risks for Troubled Muni Debt
- Alabama Gulf Coast Zoo Missed Loan Payment Backing Muni Debt
Ahhh, the siren song of yield.
Yield is a promise to pay and is only as good as the entity making the promise. It’s more of a measure of risk than anything else — more yield, more risk. Yes, default rates are meager in the municipal bond market. But the results of default, even a technical default, can devastate a portfolio’s performance. Don’t let the promise of high yields attract you to the rocks of default. Wait until you are paid, relative to everything else, to take credit risk.
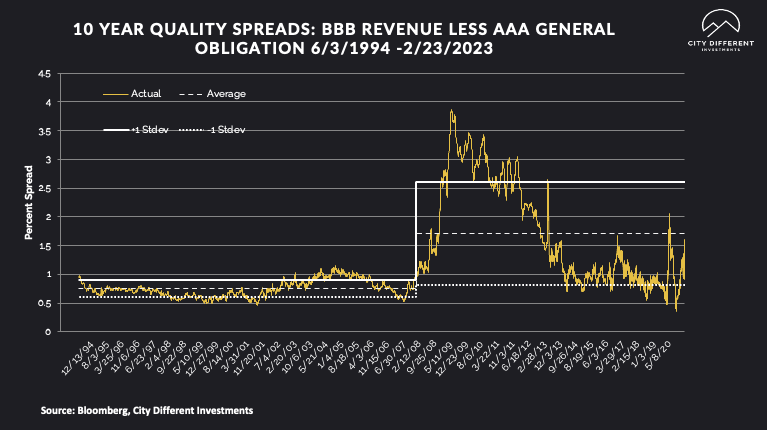
10-year quality spreads (AAA vs. BBB) were unchanged on the week. No real surprise, given the lack of volatility.
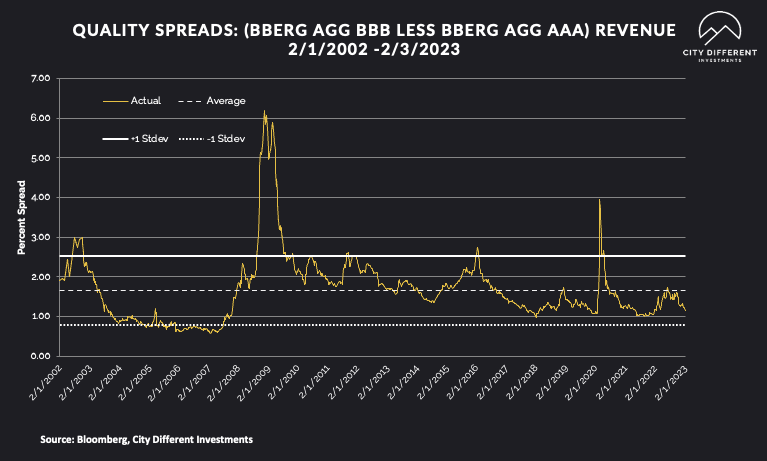
Both readings tell the same story: credit spreads are at the lower end of the fair range and not wide enough for CDI to take a strategic position. Given this week’s weak economic data, we feel these spreads will likely widen in the future.
WHERE ARE FIXED-INCOME INVESTORS PUTTING THEIR CASH?
Money Market Flows (millions of dollars)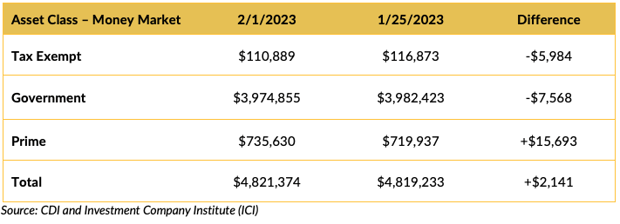
Prime money market funds were the winners last period as investors continue to be attracted to money market funds, enticed by the inverted yield curve’s alluring yields.
Mutual Fund Flows (millions of dollars)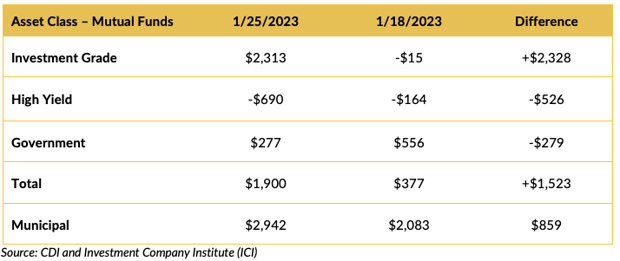
Looks like investment-grade bond funds won the last period. Municipal bond funds also had a positive period. This was, however, before the employment numbers were released. Next period should be interesting.
ETF Fund Flows (millions of dollars)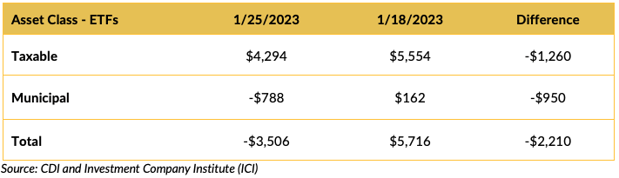
Bond ETFs saw negative cash flows for the last period.
SUPPLY OF NEW ISSUE MUNICIPAL BONDS
We estimate that next week’s new issue supply will be low, around $4.9 billion.
Total new issuance supply figures of $10 billion or more usually indicate weakness in new issue supply pricing (higher yields).
CONCLUSION
The fixed income market doesn’t seem to believe that Chairman Powell will carry out the plan he outlined in Jackson Hole, although he has been very consistent. The jobs number seems to support his position. As we have stated earlier, we can build a bull and bear scenario for fixed income returns with equal conviction. 2023 looks like it will be a tougher directional year for fixed income assets. As such, we will continue to position our clients' accounts closer to the neutral duration targets until our conviction changes (one way or the other).
We give a lot of credence to the old saw, “Don’t fight the Fed.”
IMPORTANT DISCLOSURES
The information and statistics contained in this report have been obtained from sources we believe to be reliable but cannot be guaranteed. Any projections, market outlooks or estimates presented herein are forward-looking statements and are based upon certain assumptions. Other events that were not taken into account may occur and may significantly affect the returns or performance of these investments. Any projections, outlooks or assumptions should not be construed to be indicative of the actual events which will occur. These projections, market outlooks or estimates are subject to change without notice.
Please remember that past performance may not be indicative of future results. Different types of investments involve varying degrees of risk, and there can be no assurance that the future performance of any specific investment, investment strategy, or product or any non-investment related content, made reference to directly or indirectly herein will be profitable, equal any corresponding indicated historical performance level(s), be suitable for your portfolio or individual situation, or prove successful. Due to various factors, including changing market conditions and/or applicable laws, the content may no longer be reflective of current opinions or positions.
All indexes are unmanaged, and you cannot invest directly in an index. Index returns do not include fees or expenses. Actual portfolio returns may vary due to the timing of portfolio inception and/or investor-imposed restrictions or guidelines. Actual investor portfolio returns would be reduced by any applicable investment advisory fees and other expenses incurred in the management of an advisory account.
You should not assume that any discussion or information contained herein serves as the receipt of, or as a substitute for, personalized investment advice from City Different Investments. To the extent that a reader has any questions regarding the applicability above to his/her individual situation or any specific issue discussed, he/she is encouraged to consult with the professional advisor of his/her choosing. City Different Investments is neither a law firm nor a certified public accounting firm and no portion of this content should be construed as legal or accounting advice.
A copy of City Different Investments' current written disclosure statement discussing our advisory services and fees is available for review upon request.
Unless otherwise noted, City Different Investments is the source of information presented herein.
A description of the indices mentioned herein are available upon request.