.png)

WEEK ENDING 4/21/2023
Highlights of the week:
- Is this the start of a credit crunch?
- Health of corporate credits is deteriorating.
- US economy is stalling, but not yet in a recession.
A CITY DIFFERENT TAKE
What is a credit crunch? It’s a restriction or tightening of lending standards by banks to individuals and corporations.
The banking crisis of March 2023 may have stabilized, but a tightening in credit conditions has emerged.
For those tracking bank lending, the data is mixed. Federal Reserve data shows deposits at U.S. banks are around $17.4 trillion as of the week ended April 12. We believe the shrinking deposit base will cause tightening in lending standards. However, until now, this has not played out in lending numbers. The Federal Reserve H.8 report provides an estimated weekly aggregate balance sheet for commercial banks. This report showed an uptick in lending led by residential and consumer loans for the same period.
But the first rung of the credit crunch affects less-qualified borrowers. An example here is a fall in auto loans for consumers with lower credit scores. An unwillingness by banks to lend can extend to tighter capital expenditure credit constraints for corporations and to a slowdown of spending for consumers. This slowdown in growth should be a welcome headwind for the Federal Reserve in its fight against inflation.
This is a good time for corporations to examine their balance sheets and think through the costs of funding for the future. Low-quality borrowers will be penalized as credit gets scarce and rates continue to climb. S&P’s Global Ratings came out with a report stating 37 companies defaulted on their interest payments in the first quarter of 2023.
“The rating agency expects the U.S. economy to slip into a shallow recession in 2023, and the default rate of junk-grade companies to reach 4% by December, up from the 2.5% rate over the past 12 months.”
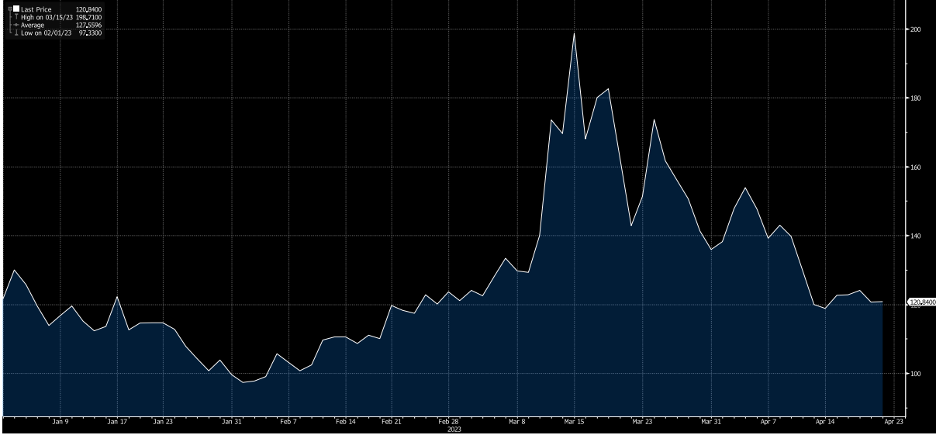
Here is a yield curve weighted index that measures implied volatility on one-month Treasury options. This index reached a high of 199 during March’s banking uncertainty and currently stands at 121.8, a 38% drop.
According to the Federal Reserve’s Beige Book, consumer spending was seen as flat. Consumer spending accounts for about two-thirds of the U.S. economy. The Beige Book reports that risks to the economic outlook are growing. It also notes tightening of lending standards. However, note that the U.S. economy is tied closely to the labor market. A tight labor market continues to keep inflationary wage pressures. As we wrote in our last weekly commentary, core inflation remains sticky even though inflation has peaked. A May rate hike of 25 basis points is very much on the table.
CHANGES IN RATES
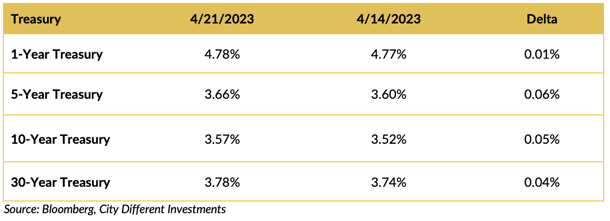
The Treasury curve steepened the week before last. Last week, the short-end Treasury held on to the trend, but gave up yield in the longer tenors.
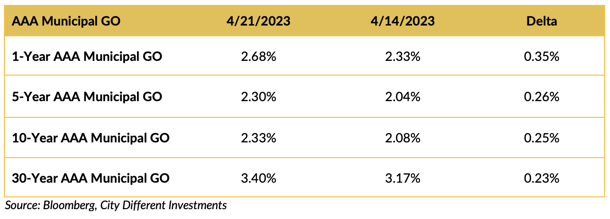
The municipal market’s week ripped and roared as far as yields went. Bloomberg noted this trend in the article “Muni Yields Surge Most in Six Months Quashing Ultra-Rich Values.”
“Ratios had gotten pretty tight because munis did what munis do, which is have a lag to Treasuries,” said Sweta Singh, portfolio manager at City Different Holdings LP.
Yes, that’s our very own Sweta Singh. We would say it was this lag effect, in addition to a robust calendar last week, where the market needed higher yields for the deals to get done.
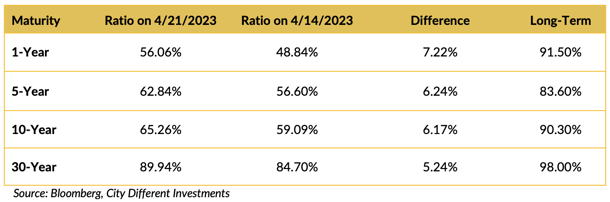
Municipals continue to look unattractive. But last week’s rally in rates helped boost ratios.
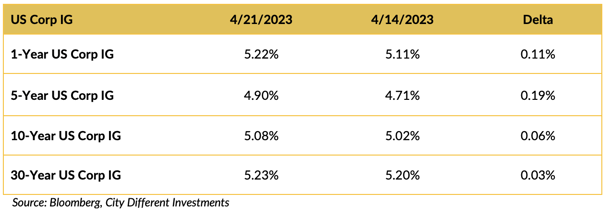
Yield in the investment grade (IG) corporate market moved higher on the week. Changes in the front end reflect the focus of the rates rally.
THIS WEEK IN WASHINGTON
.png?width=1920&name=graphs%20in%20order%20(1).png)
The debt-ceiling drama continues in Washington. As of this writing, Speaker McCarthy does not have support to pass his bill. For those curious, our current statutory debt limit stands at $31.2 trillion. A decade ago, the debt limit was $16.7 trillion — that’s an 87% increase.
Investors are demanding a higher premium with regard to Treasury bills that are maturing in the next three-month window. There is roughly a 150+ basis point jump in yield for May 15 maturity versus a May 30 Treasury bill. In addition, this risk is reflected in the credit default swaps for the federal government. U.S. one-year credit default swaps are currently at 105 versus a comparable of 80 in 2011.
The bottom line here is that the Treasury needs a cash influx currently in the form of tax revenue before the politicians can agree. Currently, the cash numbers from the Internal Revenue Service have been a bit underwhelming at $108 billion on April 18.
On the political front, there is certainly not much excitement to see a rematch of Biden vs. Trump in 2024. However, the probability of this matchup seems to be increasing.
WHAT, ME WORRY ABOUT INFLATION?
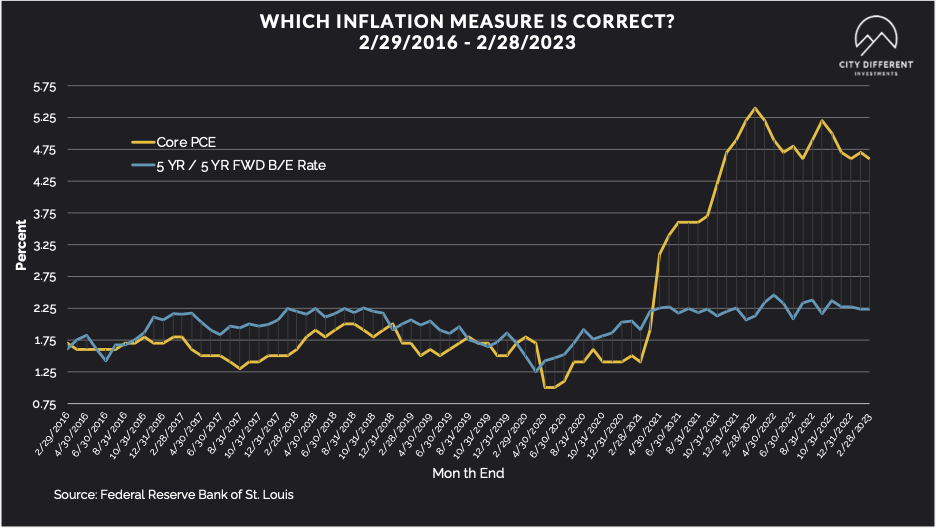
The 5-year Breakeven Inflation Rate ended the week at 2.26%, 3 basis points lower than the April 14 closing of 2.29%. The 10-year Breakeven Inflation Rate ended the week at 2.28%, 2 basis points lower than last week’s observation of 2.30%.
MUNICIPAL CREDIT
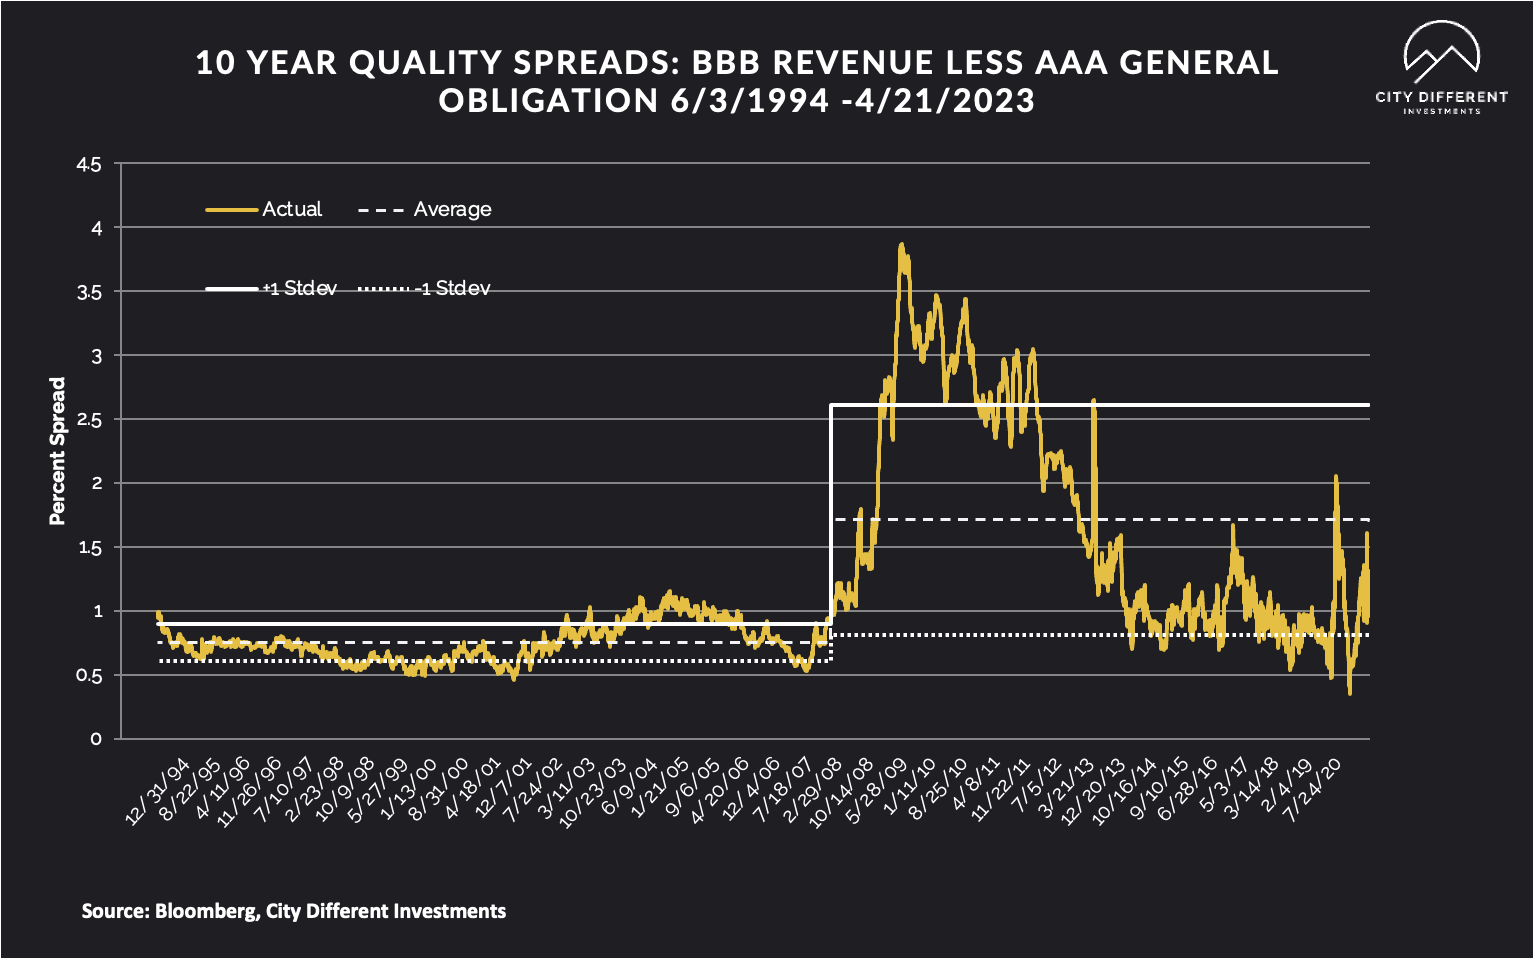
Most of the action was contained on the rates side for the municipal market. 10-year quality spreads (AAA vs. BBB) remained unchanged at 1.30% (based on our calculations). The long-term average is 1.71%. By our way of thinking, lower quality securities are still not attractive.
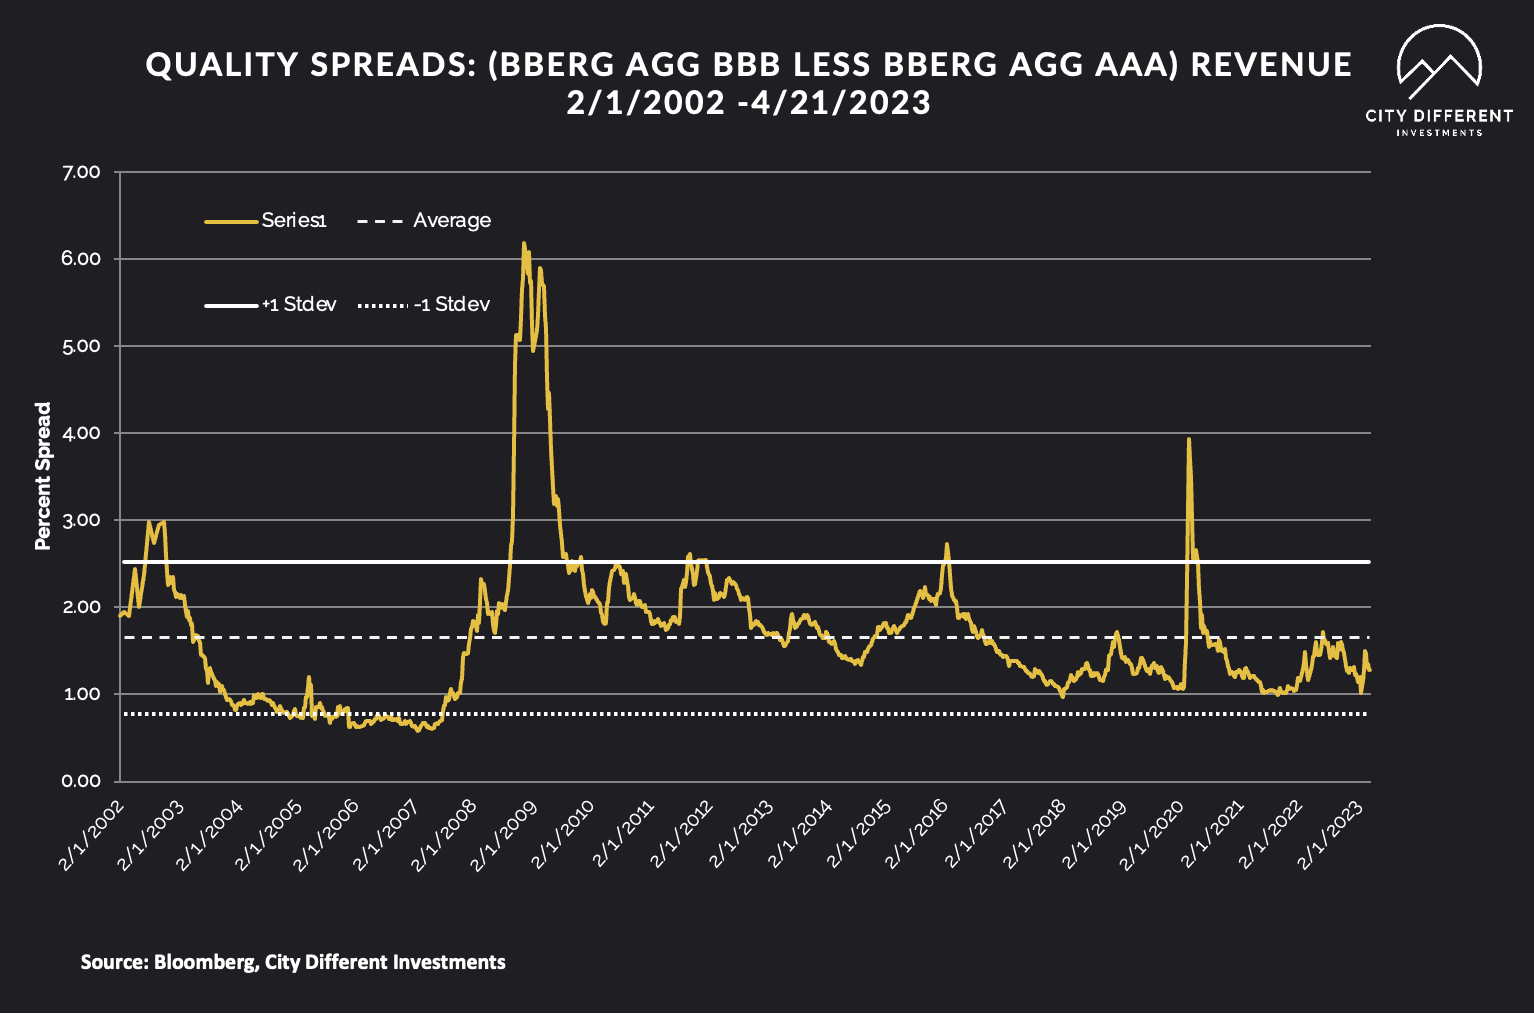
Quality spreads in the taxable market too remained still ended the week at 1.28%.
WHERE ARE FIXED-INCOME INVESTORS PUTTING THEIR CASH?
Money Market Flows (millions of dollars)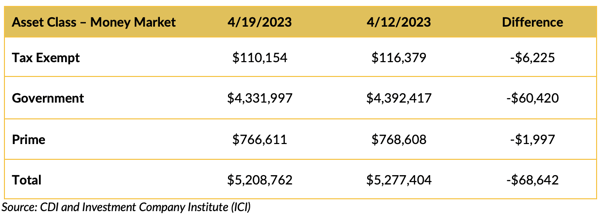
Money market funds saw negative cash flows last week, especially government money market funds. However, we think flows are normalizing.
Mutual Fund Flows (millions of dollars)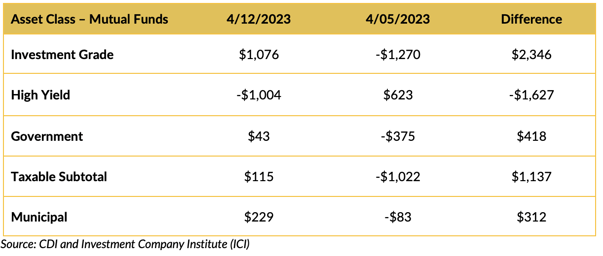
Flows returned back to bonds. We saw positive flow for the taxable segment and a big pick up in muncipals.
ETF Fund Flows (millions of dollars)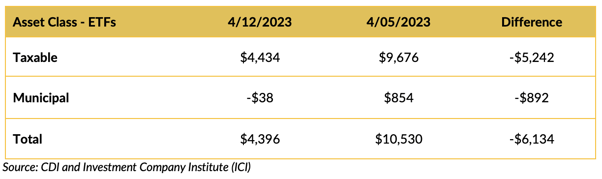
ETFs saw a big outflow in the taxable category. Municipal, too, exhibited fund outflow reflected in the totals for this week.
SUPPLY OF NEW ISSUE MUNICIPAL BONDS
After the market absorbed a big calendar last week, we have another decent size primary market issuance lined up for this week. This week’s supply is slated somewhere around $9.3 billion.
CONCLUSION
The horsemen of the credit crunch and corporate distress are arriving. However, the U.S. labor market remains strong and is holding up the U.S. economy.
IMPORTANT DISCLOSURES
The information and statistics contained in this report have been obtained from sources we believe to be reliable but cannot be guaranteed. Any projections, market outlooks or estimates presented herein are forward-looking statements and are based upon certain assumptions. Other events that were not taken into account may occur and may significantly affect the returns or performance of these investments. Any projections, outlooks or assumptions should not be construed to be indicative of the actual events which will occur. These projections, market outlooks or estimates are subject to change without notice.
Please remember that past performance may not be indicative of future results. Different types of investments involve varying degrees of risk, and there can be no assurance that the future performance of any specific investment, investment strategy, or product or any non-investment related content, made reference to directly or indirectly herein will be profitable, equal any corresponding indicated historical performance level(s), be suitable for your portfolio or individual situation, or prove successful. Due to various factors, including changing market conditions and/or applicable laws, the content may no longer be reflective of current opinions or positions.
All indexes are unmanaged, and you cannot invest directly in an index. Index returns do not include fees or expenses. Actual portfolio returns may vary due to the timing of portfolio inception and/or investor-imposed restrictions or guidelines. Actual investor portfolio returns would be reduced by any applicable investment advisory fees and other expenses incurred in the management of an advisory account.
You should not assume that any discussion or information contained herein serves as the receipt of, or as a substitute for, personalized investment advice from City Different Investments. To the extent that a reader has any questions regarding the applicability above to his/her individual situation or any specific issue discussed, he/she is encouraged to consult with the professional advisor of his/her choosing. City Different Investments is neither a law firm nor a certified public accounting firm and no portion of this content should be construed as legal or accounting advice.
A copy of City Different Investments' current written disclosure statement discussing our advisory services and fees is available for review upon request.
Unless otherwise noted, City Different Investments is the source of information presented herein.
A description of the indices mentioned herein are available upon request.