.png)

WEEK ENDING 11/11/2022
Highlights of the week:
- October’s Consumer Price Index finally shows that Fed policy is working.
- China’s opening is inflationary for the United States.
- Midterms resulted in a red ripple, not the anticipated red wave.
- Bear market’s first victim is crypto, with FTX filing for Chapter 11.
A CITY DIFFERENT TAKE
The Consumer Price Index caved in a bit last week, leading to exuberant equity markets. October’s year-over-year CPI headline reading dropped from 8.2% to 7.7%.
What helped marginally slow down inflation? Disinflation across goods and medical services. This means that companies are offering discounts to move excess inventory in industries like automotive, electronics, apparel, and furnishings We remain cautionary, however, since one number does not a trend make. On closer examination, we noticed no such downtrends in other components of inflation, such as shelter.
Housing costs grew by 0.8% in October. But there is a silver lining. Monthly increases in rents of primary residences and owner’s equivalent rents of residences are both slowing down after months of increases.
Another inflation component of concern is energy prices, which increased by 1.8% in October. Finally, food prices rose 0.6%. So even though the headline CPI number has come down, these components of inflation are still running at an uncomfortably high pace for the economy and the Fed.
Our take continues to be that the Federal Reserve will keep marching forward, and Chairman Powell will continue with rate hikes toward a higher terminal rate. Even with the October CPI print, we believe the Fed’s terminal rate will be close to 5% by next May. Fed funds future is pricing in a 50-basis-point rate increase for the December meeting.
In global news, China is easing its COVID-Zero policy, which is good news for global growth. This also means, however, that the China consumer market is open for business, which is bad news for U.S. inflation — particularly for gas prices. China’s drop in fuel demand led to a decline in prices in June of this year. A reopening will increase demand and likely cause a reversal of this trend.
Every bear market claims a victim, and on Friday, cryptocurrency exchange FTX filed for bankruptcy.
As part of the filing, CEO Sam Bankman-Fried resigned, replaced by Jon Ray III (the restructuring expert who served during Enron’s bankruptcy).
The quick and slippery road to bankruptcy started when FTX’s native crypto token FTT started falling. The run on crypto really sped up when a rival exchange announced selling $529 million worth of coins due to price drops. This led to a freefall.
This is the most prominent bankruptcy of the year; more than 130 entities are tied to FTX. In 2021, FTX had more than 5 million users worldwide and traded more than $700 billion annually.
Bankman-Fried once hailed as the crypto whiz kid, is also under investigation for possible SEC violations.
The Fed’s most aggressive tightening cycle is taking some easy money institutions as its first victims. We do not yet know the impact of the bankruptcy or the ripple effect, but we’ve seen months of tech devaluation in the stock market. To quote Warren Buffet, this is when we will see “who is swimming naked as the tide goes out.”
On a somewhat related note, we are starting to see better covenants and tighter lending standards in the private credit markets.
CHANGES IN RATES
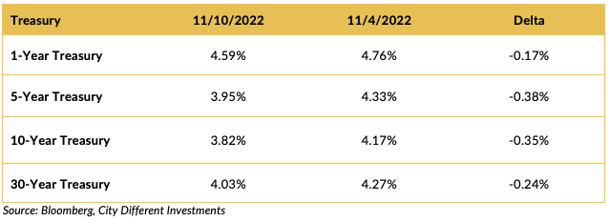
Treasury rates moved lower on the week after a better-than-expected CPI number. The Treasury curve inverted further, moving from last week’s -0.49% to the current -0.56%. We think the serious rally experienced in both the equity and bond markets reflects the short positions investors established, expecting a higher CPI number. We do not think this one number will cause the Fed to “pivot,” but it does improve the probability of a 50-basis-point increase in the target rate in December. We believe that the Fed is still on the path of “slower, longer, and higher.”
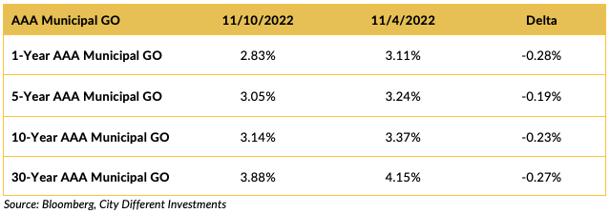
The municipal market yields moved lower on the week, replicating the rally in the Treasury market. The slope on the AAA general obligation municipal bond curve was virtually unchanged.
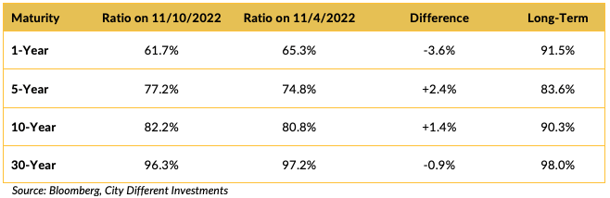
Muni ratios were mixed on the week.
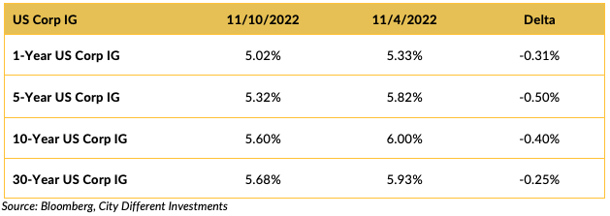
Investment-grade rates were also lower on the week.
THIS WEEK IN WASHINGTON

Tuesday’s midterm elections kicked off a very big week in Washington. With high inflation and the president’s low approval rating, markets (and pundits) expected a “red wave.” As results poured in Tuesday night, the red wave looked more like a red ripple.
Democrats retained control of the Senate and have a chance to pick up another seat on December 6 in the Georgia runoff. Dems will also try to do what seemed unimaginable on the morning of Election Day: hold onto the House. At the time of writing, control is still up for grabs, with Republicans holding a slim lead. Regardless of who holds the majority, the margin will be incredibly tight.
WHAT, ME WORRY ABOUT INFLATION?
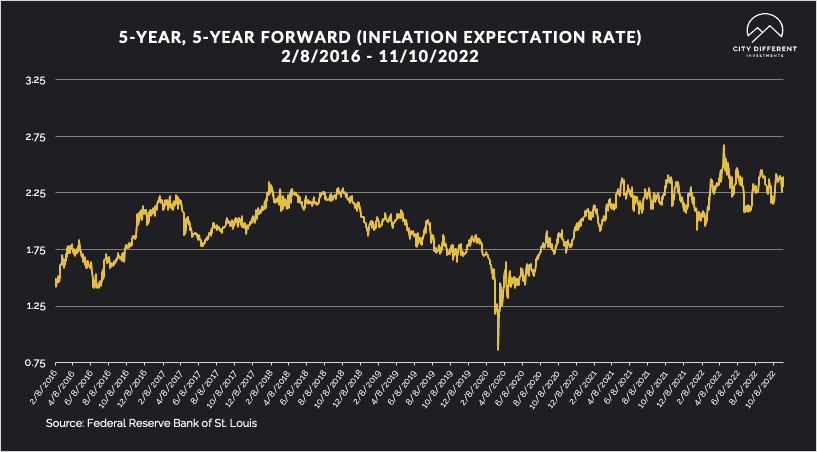
The 5-year Breakeven Inflation Rate ended at 2.31%, four basis points lower than the prior week closing at 2.35%. The 10-year Breakeven Inflation Rate ended the week at 2.39%, nine basis points lower than the last reported observation of 2.48%. Both readings seem low, given where inflation is today.
MUNICIPAL CREDIT
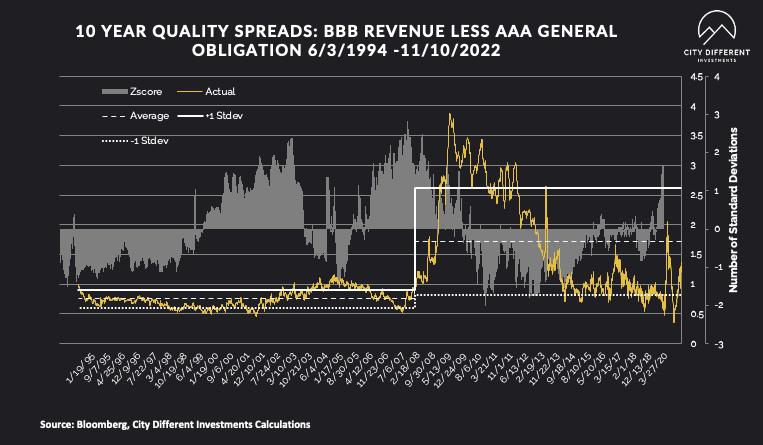
Long-term quality spreads continued to widen, moving further into the fair range, and are starting to pique our interest. Not quite “soup” yet, but more and more interesting each week. While we don’t think the move has been significant enough to change our strategic outlook toward credit, it's getting close.
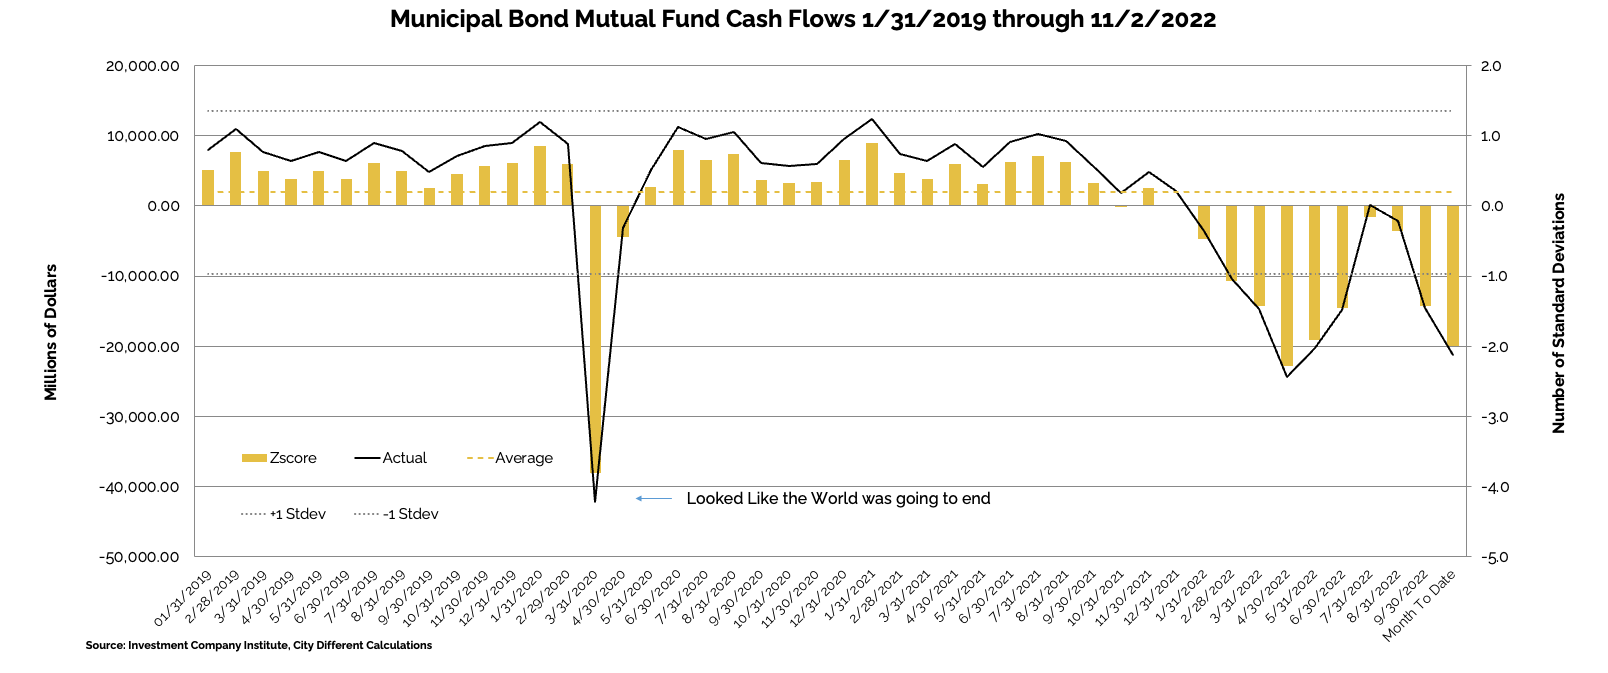
WHY IS THE MUNICIPAL MARKET BEHAVING THIS WAY?
Various sources are used to report cash flows related to municipal bond mutual funds and ETFs, all reporting at different times. The source we have chosen to use is the Investment Company Institute (I.C.I.). The I.C.I. reported weekly cash flows from municipal bond mutual funds for the week of November 2, as -$3.8 billion, which is the same outflow as last week.
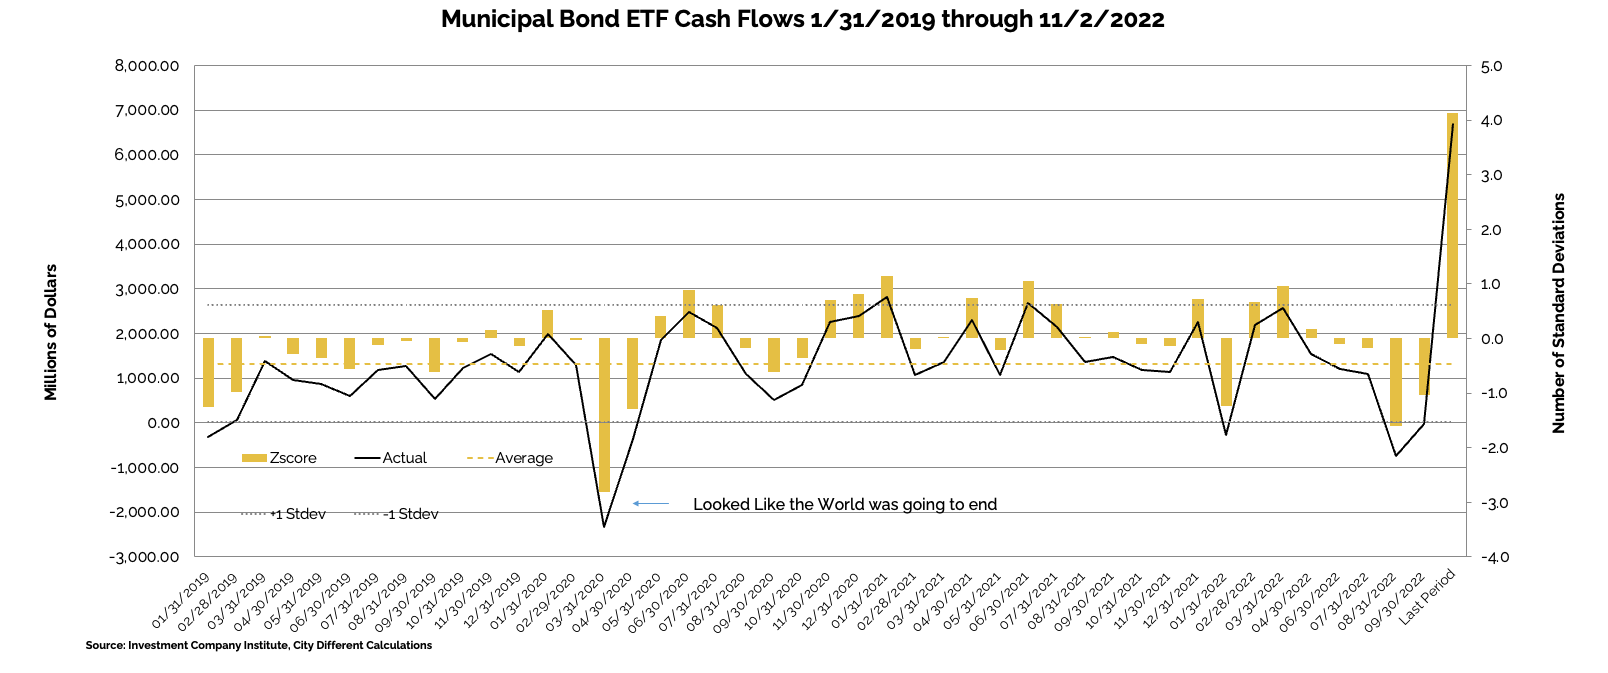
Municipal bond ETF cash flows for the same period were +1.1 billion, compared to +1.0 billion the prior week.
Other cash flow sources:
In its Municipal Markets Weekly newsletter, JP Morgan commented on cash flow data this week, stating that:
“Lipper reported combined weekly and monthly outflows of $9.2 billion for the period ending November 9, the largest since the period ending May 11 ($10.1 billion), increasing YTD record outflows to $113 billion, and now matching the longest outflow cycle on record (44 weeks, 2013).”
SUPPLY OF NEW ISSUE MUNICIPAL BONDS
In its Municipal Markets Weekly newsletter, JP Morgan commented on the supply picture this week, stating that:
“Next week’s volume is nearly all tax-exempt, at $8.1 billion, or 90% of the same week average over the past 5 years, while taxable supply of just $212 million is 8% of the 5-year average.”
The supply picture does not get interesting until it exceeds $10 billion tax-exempt issuances in a given week.
CORPORATE INVESTMENT GRADE AND HIGH YIELD OVERVIEW
In U.S. Investment Grade land, IG Credit primary market supply picked up last week with $31.5 billion in issuance.
In its weekly "Credit Flows" report, Wells Fargo commented:
“Dispersion and volatility in fund flows continued as US IG flipped to $0.4 billion inflow, while US HY inflow decelerated sharply to $0.6 billion. Leveraged loans resumed its trend of outflows, with a redemption of $0.4 billion this past week. Among international markets, Euro IG had inflow of $1.6 billion, while Euro HY reported outflow of $0.1 billion. EM’s $3.8 billion outflow marked its twelfth consecutive weekly redemption. Supply was strong across the board, with US IG, HY, and Loans reaching multi-week highs at $49.6 billion, $6.2 billion, and $5.8 billion, respectively. As of the prior week, dealers trimmed their net long in US IG to $5.7 billion, and reduced their net short in US HY to $1.1 billion.”
CONCLUSION
This was a week filled with big news and a lot of buts.
Softer headline CPI numbers sent the stock market soaring, but underlying components of inflation are also soaring.
China reopening is good for growth, but an added inflationary pressure for the Fed.
FTX is the first large-scale bankruptcy of this bear market, but its ripple effect is yet to be felt.
Midterm results were weaker than expected for Republicans, but we’re still awaiting House results.
We’ll see how all of this plays out in the weeks ahead.
.png?width=660&name=signature%20block%20(3).png)
IMPORTANT DISCLOSURES
The information and statistics contained in this report have been obtained from sources we believe to be reliable but cannot be guaranteed. Any projections, market outlooks or estimates presented herein are forward-looking statements and are based upon certain assumptions. Other events that were not taken into account may occur and may significantly affect the returns or performance of these investments. Any projections, outlooks or assumptions should not be construed to be indicative of the actual events which will occur. These projections, market outlooks or estimates are subject to change without notice.
Please remember that past performance may not be indicative of future results. Different types of investments involve varying degrees of risk, and there can be no assurance that the future performance of any specific investment, investment strategy, or product or any non-investment related content, made reference to directly or indirectly herein will be profitable, equal any corresponding indicated historical performance level(s), be suitable for your portfolio or individual situation, or prove successful. Due to various factors, including changing market conditions and/or applicable laws, the content may no longer be reflective of current opinions or positions.
All indexes are unmanaged, and you cannot invest directly in an index. Index returns do not include fees or expenses. Actual portfolio returns may vary due to the timing of portfolio inception and/or investor-imposed restrictions or guidelines. Actual investor portfolio returns would be reduced by any applicable investment advisory fees and other expenses incurred in the management of an advisory account.
You should not assume that any discussion or information contained herein serves as the receipt of, or as a substitute for, personalized investment advice from City Different Investments. To the extent that a reader has any questions regarding the applicability above to his/her individual situation or any specific issue discussed, he/she is encouraged to consult with the professional advisor of his/her choosing. City Different Investments is neither a law firm nor a certified public accounting firm and no portion of this content should be construed as legal or accounting advice.
A copy of City Different Investments' current written disclosure statement discussing our advisory services and fees is available for review upon request.
Unless otherwise noted, City Different Investments is the source of information presented herein.
A description of the indices mentioned herein are available upon request.