.png)

WEEK ENDING 10/28/2022
Highlights of the week:
- The Federal Reserve prepares for a possible 75 bps rate hike this Wednesday.
- The second biggest event is the nonfarm payroll report this Friday.
- Positive third-quarter GDP (after two negative quarters) hides some declining components.
A CITY DIFFERENT TAKE
Welcome to the “Fed week.”
The Federal Reserve meets this Wednesday to decide on interest rate hikes. Forecasts call for another outsized increase of 75 bps, the fourth jumbo increase this year. This would move the terminal rate target range to 3.75%–4%. Forecasts by both Goldman Sachs and Bloomberg Economics estimate Fed rates at 5% by March 2023.
The game changer for the market won’t be the baked-in rate increase but any communication of how the Fed will moderate the pace of future rate hikes. We at City Different Investments believe that the Federal Reserve will not necessarily lower the terminal rate right away. They may, however, communicate a moderation of future rate increases. (The market is speculating a 50-bps rate increase for the December meeting.) Core inflation remains high. Governor Powell must balance these rate increases as the U.S. Labor market is still going strong.
We will receive important news from the Labor market on Friday when nonfarm payrolls are due as part of the monthly employment report. Economists will watch this number closely. Predictions are around 220,000 new jobs added in October. This would be a mild slowdown in new job creation and a small increase in unemployment. Currently, the unemployment rate stands at a robust 3.5%.
Last week, the U.S. economy saw positive real GDP growth in Q3. Real GDP rose 2.6% from Q2. It’s important to note, however, consumer spending came down from 2% to 1.4% and residential investments also dropped. Our view is that the bigger number obfuscates the underlying slowdown in the component parts. To us, this shows that Fed tightening in monetary policy is having its intended effects.
CHANGES IN RATES
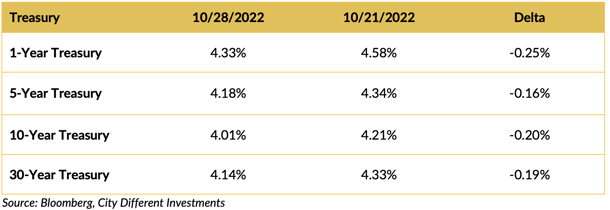
Treasury market rates did a reversal. Rates were lower through all tenors, particularly in the front end and the long end.
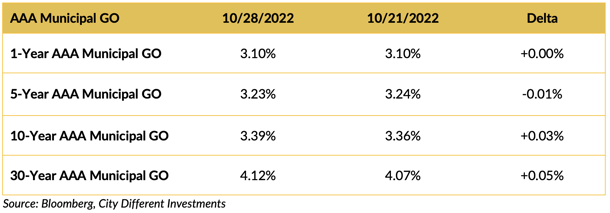
The municipal market remained completely divorced from Treasuries. The muni market remained firm in the 1-year and 5-year parts of curve. The long-end rates were a smidge higher.
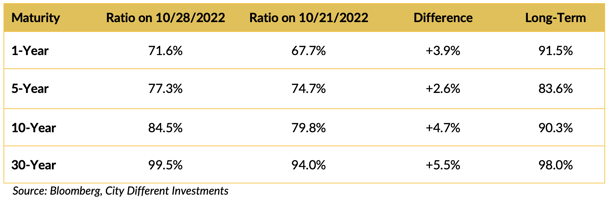
Muni ratios look attractive week of week, which is a reflection of the lower rate movement in Treasuries and robustness and stability of municipal yields.
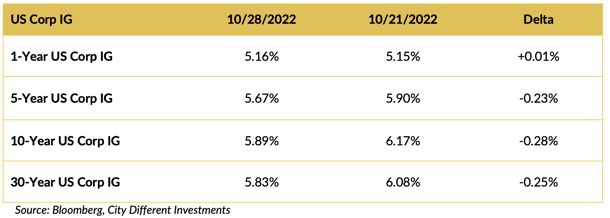
Investment-grade rates came down much like the Treasury market.
THIS WEEK IN WASHINGTON

The midterm election is Tuesday, November 8 — about a week away.
Republicans can take control of the Senate by “flipping” one seat. Over in the House, current polls predict Republicans will regain control as President Biden’s approval rating hover just over 40%.
In terms of real policy work in Washington, when Congress returns, its focus will be on extending tax breaks to corporations and low-income families.
WHAT, ME WORRY ABOUT INFLATION?
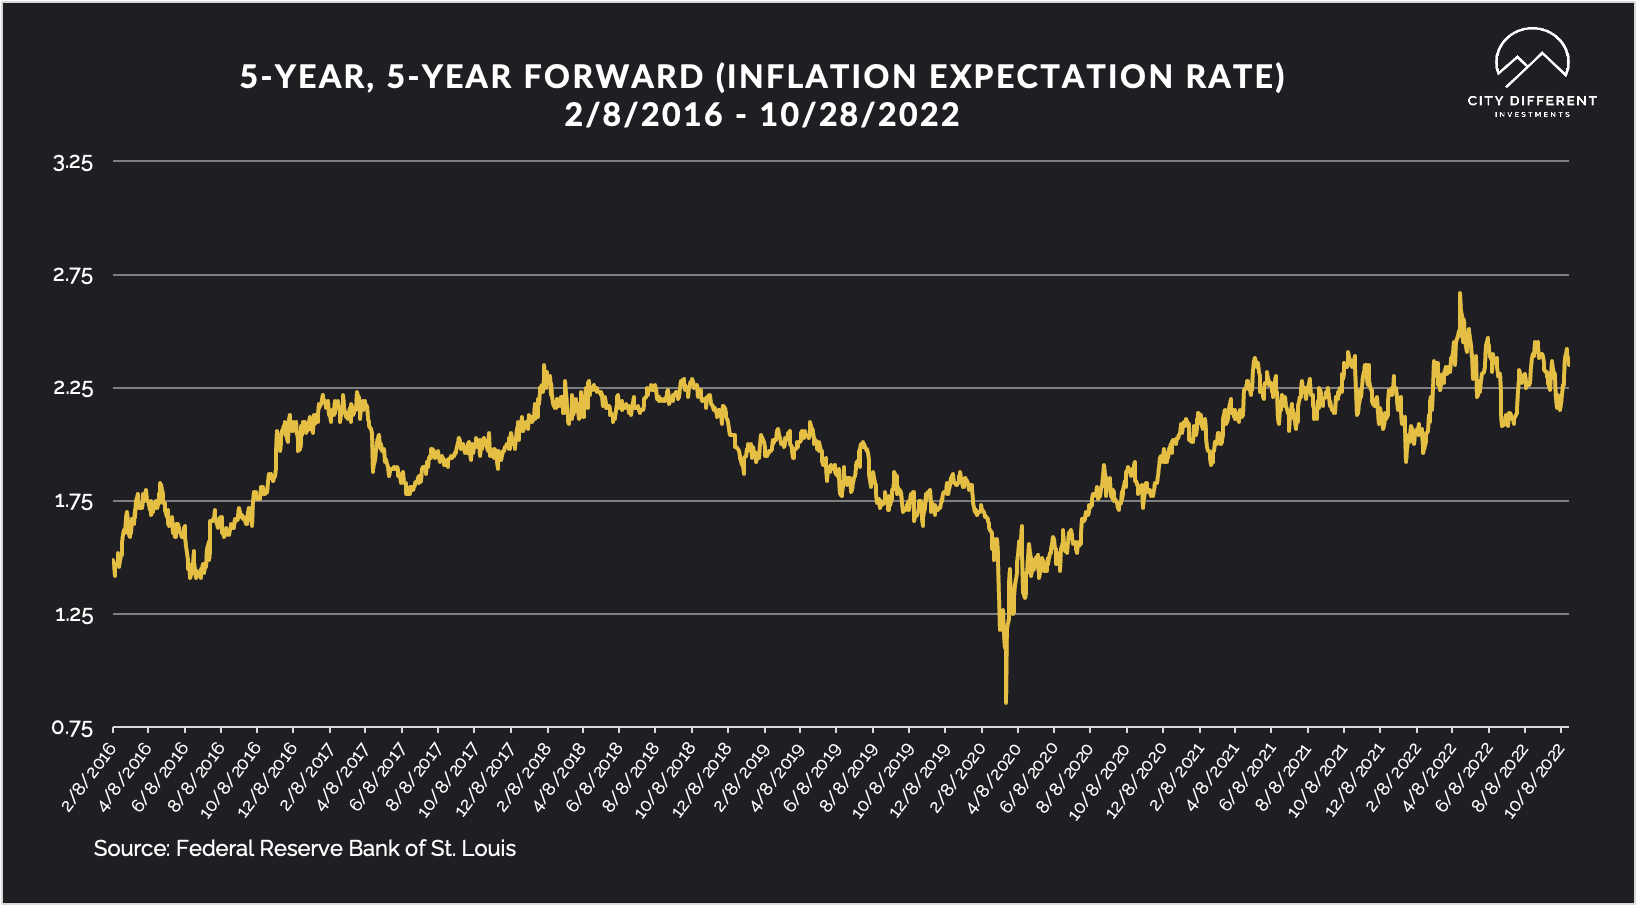
The 5-year Breakeven Inflation Rate ended at 2.4%, 5 basis points higher than the prior week, closing at 2.35%. The 10-year Breakeven Inflation Rate ended the period at 2.51%, 1 basis point lower than the last reported observation of 2.52%. Both readings seem low, given where inflation is today.
MUNICIPAL CREDIT
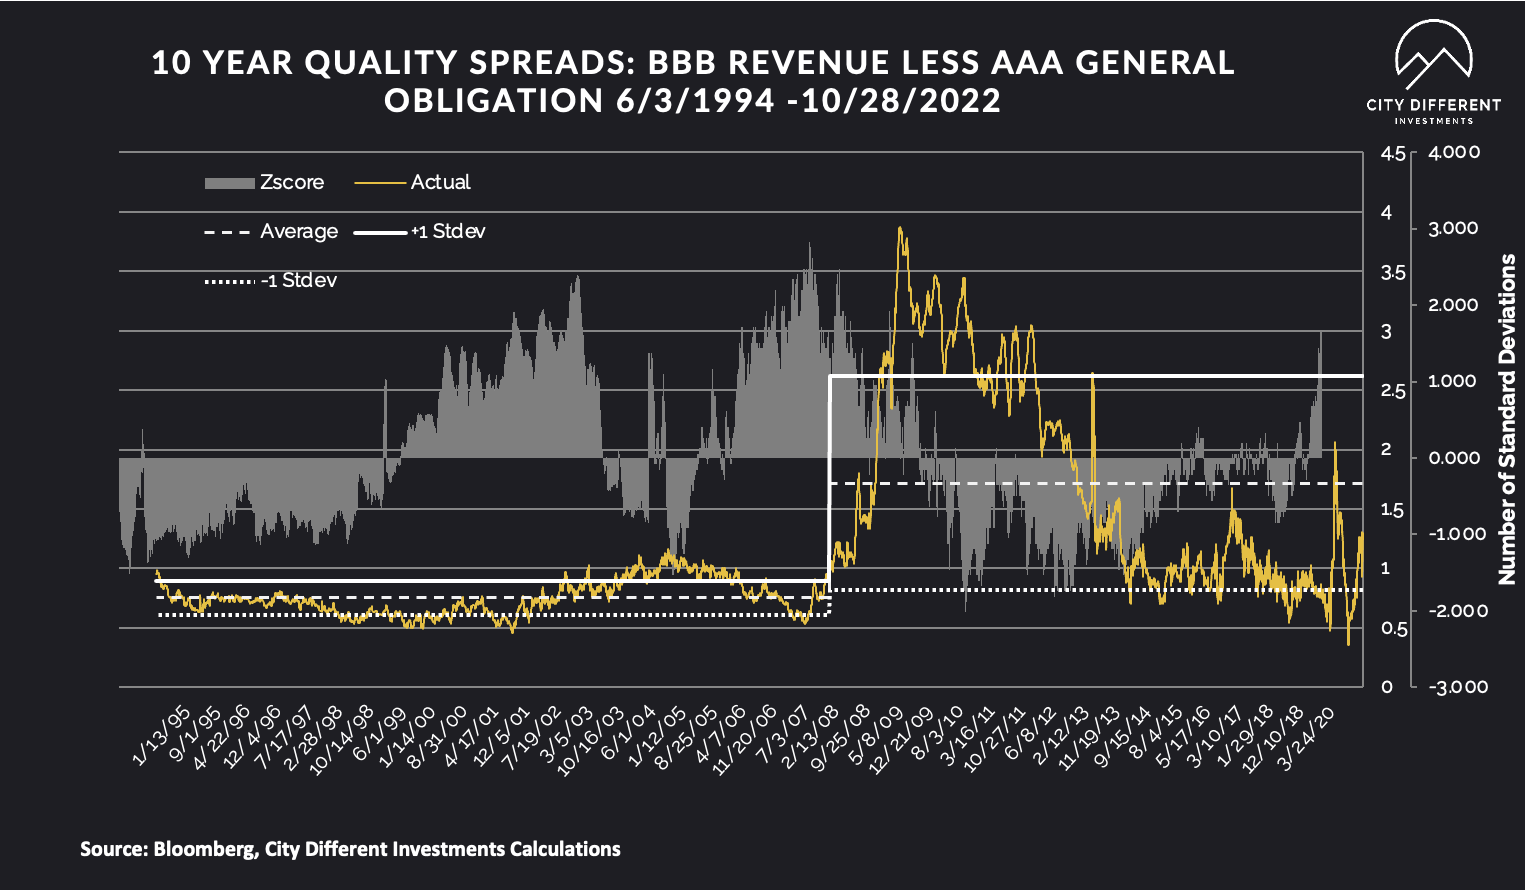
Long-term quality spreads continued to widen, moving further into the fair range, and are starting to pique our interest. While we don’t think the move has been significant enough to change our strategic outlook towards credit, it's getting close.
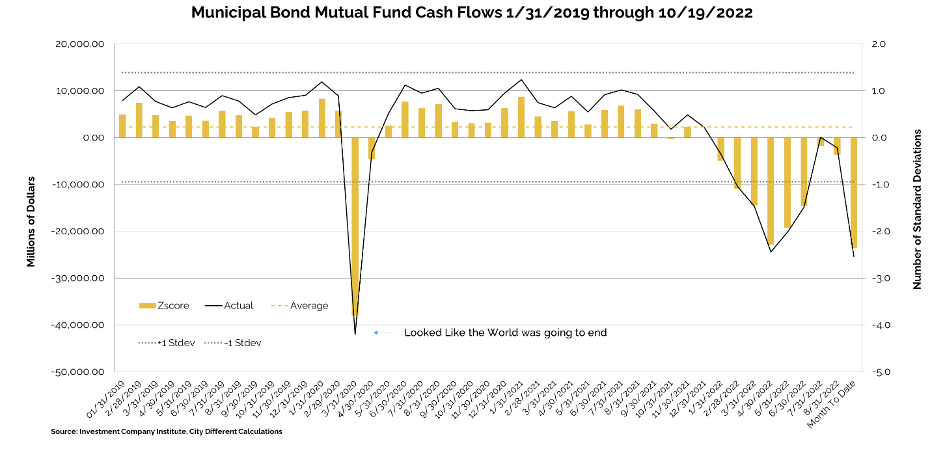
WHY IS THE MUNICIPAL MARKET BEHAVING THIS WAY?
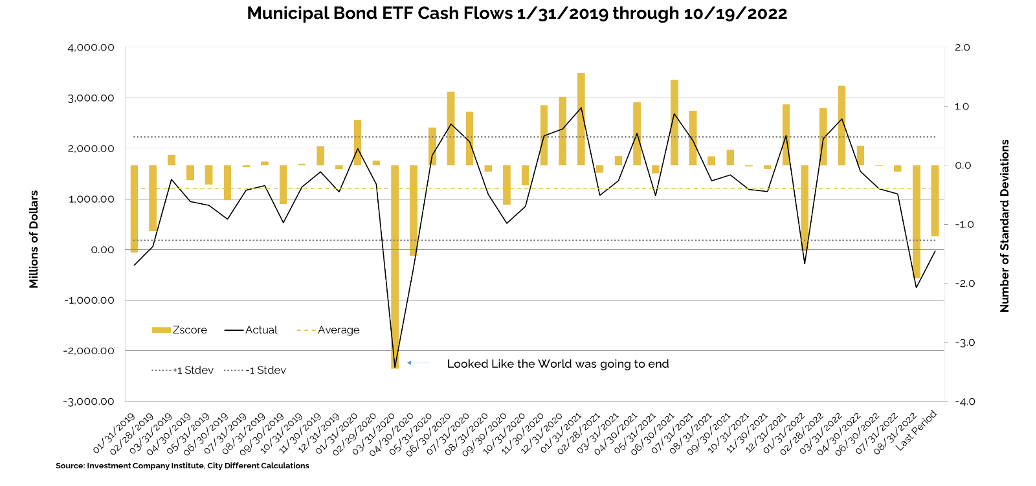
Various sources are used to report cash flows related to municipal bond mutual funds and ETFs, all reporting at different times. The source we have chosen to use is the Investment Company Institute (I.C.I.). The I.C.I. reported weekly cash flows from municipal bond mutual funds for the week of October 19, as -$3.9 billion compared to -$4.5 billion from the week before.
Municipal bond ETF cash flows for the same period were +$0.3 billion, compared to +$2.3 billion the prior week.
Other cash flow sources:
Lipper reported a 12th consecutive combined weekly and monthly outflow, with $1.8 billion leaving muni funds for the period ending October 26, increasing record YTD outflows to $104.8 billion.
SUPPLY OF NEW ISSUE MUNICIPAL BONDS
In its Municipal Markets Weekly newsletter, JP Morgan commented on the supply picture this week, stating that:
“Tax-exempt supply is not expected to overwhelm for the remainder of this year, and at least into early 2023. In fact, we expect net negative tax-exempt supply of $15 billion in November and December. Supply, however, should remain uneven, as illustrated by this week’s volume of $9.4 billion, versus next week’s Fed-stunted total supply of only $2.8 billion including tax-exempt supply of $2.5 billion (43% of average), and taxable/corp cusip supply of just $0.2 billion (13% of the average). This supply pattern should continue as coming holidays combine with Fed meetings and data releases, to make for a particularly uneven cadence of volume in the municipal market.”
The supply picture does not get interesting until it exceeds $10 billion tax-exempt issuances in a given week.
CORPORATE INVESTMENT GRADE AND HIGH YIELD OVERVIEW
In U.S. Investment Grade land, IG Credit primary market supply picked up last week with $31.5 billion in issuance.
In its weekly "Credit Flows" report, Wells Fargo commented:
“U.S. Markets: IG fund flows flipped to $1.6 billion in inflows, first inflow in nine weeks, as continuing mutual funds outflows (-$3.3 billion) were offset by strong ETF inflows (+$4.9 billion). Intermediate- (+$0.5 billion) and long-duration (+$2.0 billion) strategies reported inflows, while short-duration funds saw $1.3 billion in outflows. Supply accelerated WoW to $31.5 billion, the highest in seven weeks. HY fund flows surged to $3.7 billion in inflows, the third largest inflow of the year, predominantly from strong ETF inflows of $4.2 billion. Supply trailed off to nil this week. Leveraged Loan fund flows decelerated WoW at $0.7 billion in outflows, stretching total redemptions over past twelve weeks to $9.2 billion. In the week ended October 12, primary dealer inventories in IG were unchanged WoW at $5.9 billion net long, as dealers added $0.6 billion in 1–5 year and 10+ year maturities but reduced the same amount in the very front end and 5–10 year part of the curve. In HY, dealers reduced their net short to $0.9 billion.”
CONCLUSION
This will be a big economic week with the Federal Reserve meeting on Wednesday and nonfarm payrolls releasing on Friday. The consensus is we’ll see another 75-bps rate hike from the Fed. More important will be the tone set in forward guidance, specifically with the language surrounding pace of futures rates. Third-quarter U.S. GDP was positive, but closer examination reveals a slowdown in critical areas of the economy.
.png?width=660&name=signature%20block%20(3).png)
IMPORTANT DISCLOSURES
The information and statistics contained in this report have been obtained from sources we believe to be reliable but cannot be guaranteed. Any projections, market outlooks or estimates presented herein are forward-looking statements and are based upon certain assumptions. Other events that were not taken into account may occur and may significantly affect the returns or performance of these investments. Any projections, outlooks or assumptions should not be construed to be indicative of the actual events which will occur. These projections, market outlooks or estimates are subject to change without notice.
Please remember that past performance may not be indicative of future results. Different types of investments involve varying degrees of risk, and there can be no assurance that the future performance of any specific investment, investment strategy, or product or any non-investment related content, made reference to directly or indirectly herein will be profitable, equal any corresponding indicated historical performance level(s), be suitable for your portfolio or individual situation, or prove successful. Due to various factors, including changing market conditions and/or applicable laws, the content may no longer be reflective of current opinions or positions.
All indexes are unmanaged, and you cannot invest directly in an index. Index returns do not include fees or expenses. Actual portfolio returns may vary due to the timing of portfolio inception and/or investor-imposed restrictions or guidelines. Actual investor portfolio returns would be reduced by any applicable investment advisory fees and other expenses incurred in the management of an advisory account.
You should not assume that any discussion or information contained herein serves as the receipt of, or as a substitute for, personalized investment advice from City Different Investments. To the extent that a reader has any questions regarding the applicability above to his/her individual situation or any specific issue discussed, he/she is encouraged to consult with the professional advisor of his/her choosing. City Different Investments is neither a law firm nor a certified public accounting firm and no portion of this content should be construed as legal or accounting advice.
A copy of City Different Investments' current written disclosure statement discussing our advisory services and fees is available for review upon request.
Unless otherwise noted, City Different Investments is the source of information presented herein.
A description of the indices mentioned herein are available upon request.