.png)

WEEK ENDING 9/30/2022
Highlights of the week:
- The quest for a new terminal rate
- Global economic uncertainty led by the UK
- Quick review of the Municipal Market rate changes
A CITY DIFFERENT TAKE
Core PCE deflator for August reaffirmed an overheated economy. Core prices, which exclude food and energy, rose at the annualized rate of 7%. For August, headline inflation, which considers food and energy, rose by 0.3%, but core rose much higher by 0.6%. This mainly comes from increases in service sector prices. So, what does this mean in English?
It means that core pricing, the Fed’s favorite inflation measure, is not peaking yet. Layer on a strong labor market where job openings are still elevated, and all of this means only one thing - the Federal Reserve will continue to press on.
The terminal Fed funds futures rate indicates a 4.6% median estimate for next year versus the Fed funds future ratewhich indicates a rate of 4.4%. This comes at the heels of the chaos In England and the fear of something breaking in the financial system, along with the palpable stress in the credit markets. Fixed income markets showed several deals being pulled last week ($3 bn in High Yield markets). This was accompanied by a sea of bid lists by mutual funds selling for redemption in risky assets over the fear of recession. Average high yield spreads currently are at 500+ basis points. Signs of real distress would be seeing these levels north of 700+ basis points.
However, we don’t want to sound alarmist. Financial stability issues are not dire enough for the Federal Reserve to pause. A U.S. Bureau of Economic Analysis that tracks several economic indicators still shows a robust consumer.
A quick comment on the economic uncertainty in England. The Bank of England last week pledged to buy 65 billion pounds of UK bonds in tandem with raising rates. The logic here was that the bank was reacting to the pressures in the pension system. Meanwhile, the prime minister came into power with the agenda of gigantic debt-funded tax cuts to help with the rising energy costs, which sent the pound to new lows. It appears these actions last week have helped stabilize the market.
This Monday morning’s development out of Europe is Credit Suisse Group AG’s plunging stock price because of distress and concerns surrounding the bank’s financial health. Credit default swaps which are protection or insurance against the stock, have gone to 2009 levels. However, the stress is contained to the bank, which maintains a decent capital base and liquidity position.
CHANGES IN RATES
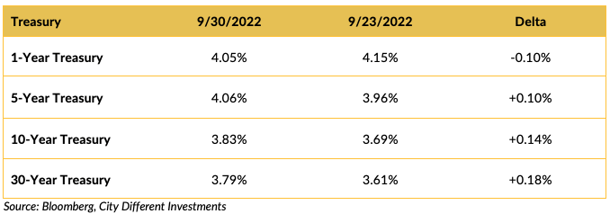
As the Treasury market continued to react to a more forceful Fed, short-term interest rates declined by 0.10%, and longer-term interest rates increased by 0.10% to 0.18%. The slope of the Treasury curve steepened by 0.28%, ending the week at a 1–30-year slope of -0.26%.
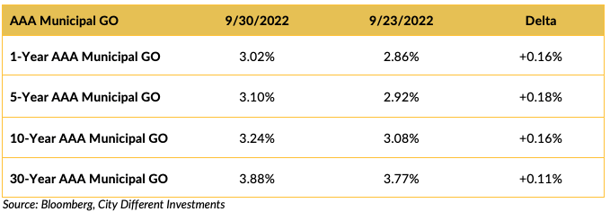
Interest rates in the municipal market also moved higher last week, anywhere from 0.11% to 0.18%, depending on the maturity of the observation. The slope of the 1–30-year yield curve flattened by 0.05%.
It really is stunning when you look at the rate changes YTD along the municipal market yield curve. The 2-year AAA Muni that currently stands at 3.09% has risen by about 285 bps year-to-date, while 5 year AAA Muni rose by 253 bps, the 10 year AAA Muni rose by 227 bps and the 30 year Muni rose by 241 bps.
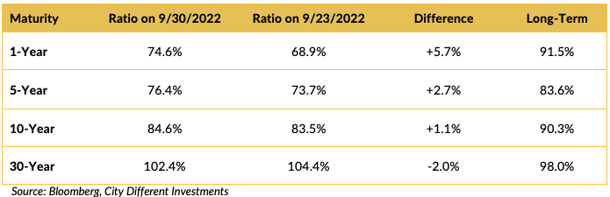
Muni-Treasury ratios moved higher last week across all but the very longest maturities. Relative to the Treasury market, all maturities of the municipal market are solidly in the fair range as CDI defines it (+/- 1 standard deviation based on weekly observations since 1994). Both yield curves are flat or inverted. These observations highlight the relative attractiveness of the municipal market in spite of (or because of) continued negative cash flows from municipal bond mutual funds (see below). If you extend the year-to-date change from the Municipal curve to the ratio relationship, the same is reflected where 2-year MMD/UST relationship has changed the most, up 39% YTD. The 5-year stands at a 30% YTD change, the 10-year at 18%, and the 30-year at 25%.
Municipal Bonds have experienced their worst month since 2008, according to a Bloomberg report issued on September 30 titled “Muni Bonds Walloped by Rate Hikes Posting Worst Month Since 2008.” It quotes the Muni index being down by 3.8% in September. However, to repeat Sweta's quote from that article.
"The tone of the market…is nowhere near distress level wide but you can definitely see the pain seep into the market,” said Sweta Singh, portfolio manager at City Different Holdings LP. “Because there is so much volatility in the market every day, you wake up to a fresh market, the way munis are moving.” (Bloomberg-Muni Bonds Walloped by Rate Hikes Posting Worst Month Since 2008)
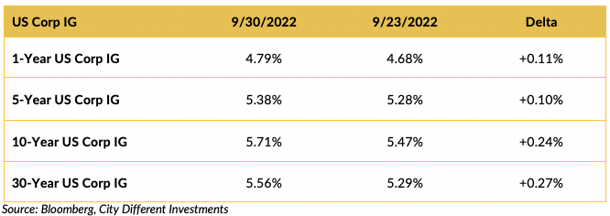
Investment-grade rates marched higher as well.
THIS WEEK IN WASHINGTON

There is much that is going on globally, including a slowdown in the overall global economy. Europe is reeling with a host of crises including continued Russian aggression, where Putin claimed areas of Ukrainian territory where Russians are losing ground. In addition, rising energy prices in the UK and Europe have led leaders pushing for price caps on Russian gas ahead of winter. Hopefully, there will be no contagion around the Credit Suisse banking drama.
Given this global context, we have our own issues at home, including Hurricane Ian in Florida. The president is touring both Florida and Puerto Rico and is vowing to do whatever it takes to assist victims. According to various news outlets, the death toll out of Florida is over 80 people.
WHAT, ME WORRY ABOUT INFLATION?
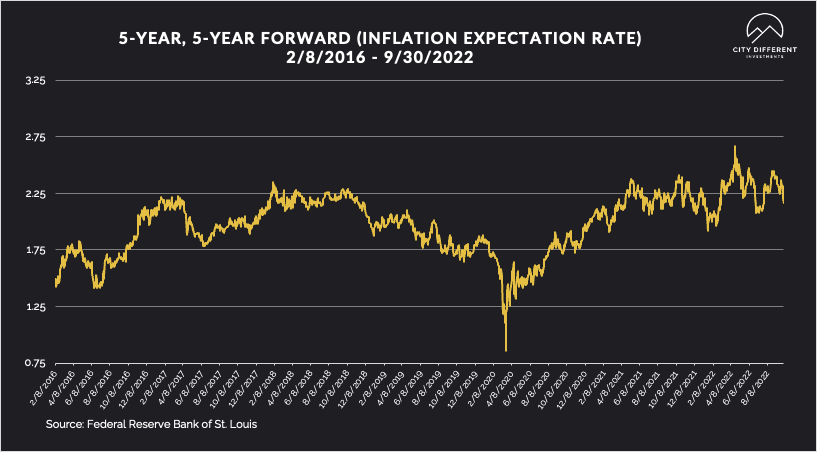
The 5-year Breakeven Inflation Rate ended at 2.16%, 20 basis points lower than the prior week closing at 2.36%. The 10-year Breakeven Inflation Rate ended the week period at 2.15%, 22 basis points lower than the last reported observation of 2.37%. Both of these readings seem low, given where inflation is today.
MUNICIPAL CREDIT
At City Different Investments, our goal is to provide an unvarnished opinion of the markets. There is no doubt that we are seeing volatility in both the fixed income and equity markets alike. However, we do not want to sound alarmist about the health of the municipal credit markets that continue to remain robust.
JP Morgan summarizes this perfectly with the following quote from its Municipal Markets Weekly newsletter from September 30th. "Municipal defaults in absolute dollar amounts and defaulted debt as a percentage of outstanding market size, have been a fraction of those in the corporate bond market, with the difference particularly evident during recessionary periods, such as 2001-2002, 2008-2009, and 2020. The relative very small rating drift compared to corporates also reflects the relative stability of municipals over the longer term”.
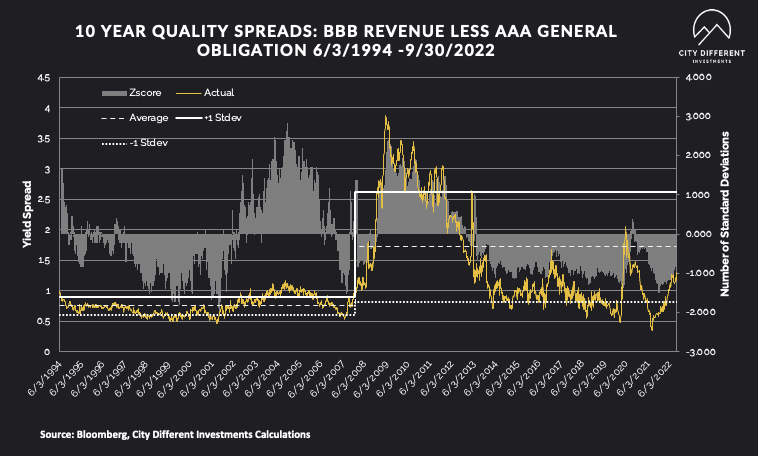
Quality spreads continued to widen, moving further into the fair range, and are starting to pique our interest. While we don’t think the move has been significant enough to change our strategic outlook towards credit, it's getting close.
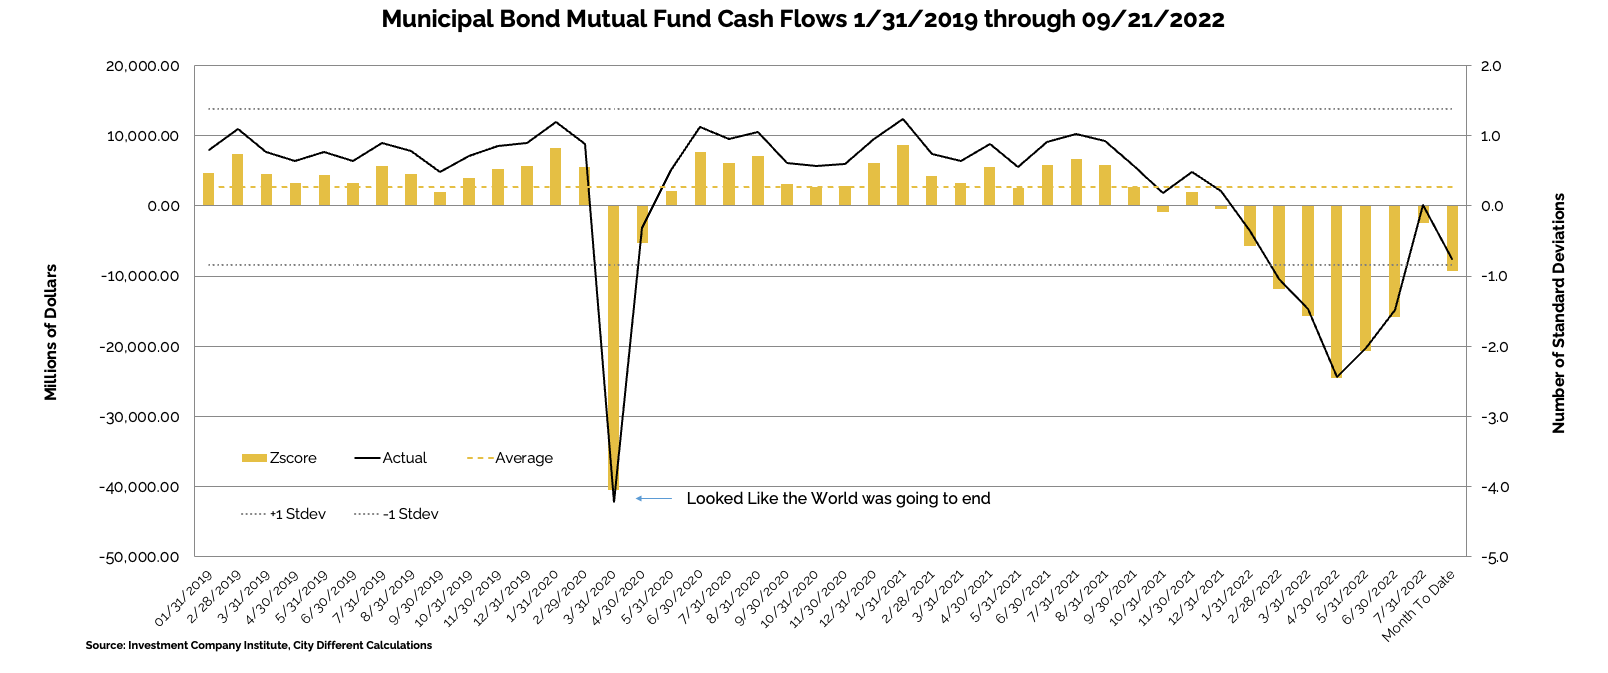
WHY IS THE MUNICIPAL MARKET BEHAVING THIS WAY?
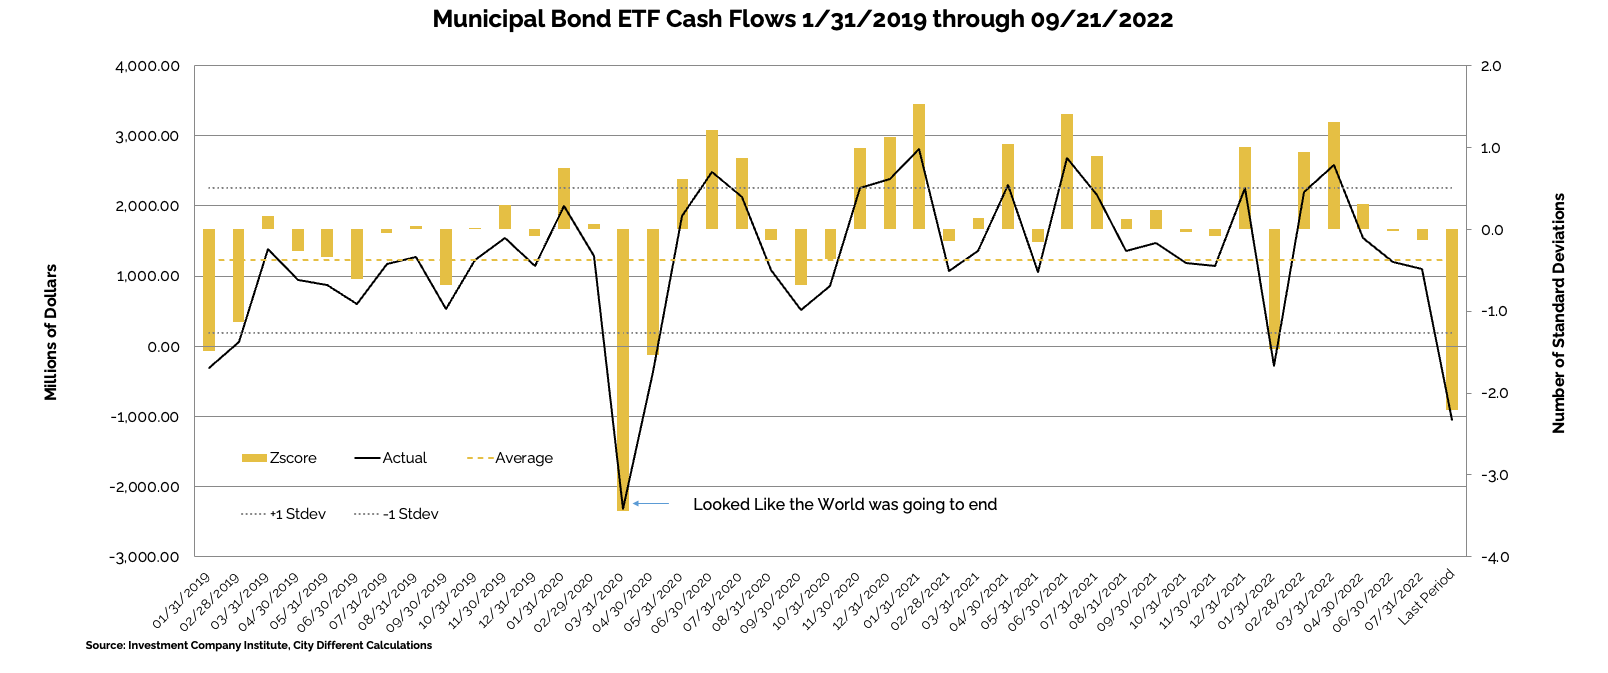
Various sources are used to report cash flows related to municipal bond mutual funds and ETFs, all reporting at different times. The source we have chosen to use is the Investment Company Institute (I.C.I.). The I.C.I. reported weekly cash flows from municipal bond mutual funds for the week of September 21st, as -$2.7 billion compared to -$1.7 billion from the week before.
Municipal bond ETF cash flows for the same period were -$492 million, compared to -$51 million the prior week.
Other cash flow sources:
Lipper reported an 8th consecutive combined weekly/monthly outflow, with $3.6bn out of muni funds, increasing the record YTD outflows to $91.5bn.
SUPPLY OF NEW ISSUE MUNICIPAL BONDS
In its Municipal Markets Weekly newsletter, JP Morgan commented on the supply picture this week, stating that:
“Next week, we expect total supply of just $4.1bn, or 39% of the 5yr equiv week avg ($10.5bn). We anticipate tax-exempt supply of $3.7bn (49% of avg), and taxable/corp cusip supply of just $0.4bn (14% of the avg).”
The supply picture does not get interesting until it exceeds $10 billion tax-exempt issuances in a given week.
CORPORATE INVESTMENT GRADE AND HIGH YIELD OVERVIEW
In U.S. Investment Grade land, spreads widened slightly to reflect the pushback from the strong US CPI data.
In its weekly "Credit Flows" report, Wells Fargo commented:
“Too many bonds chasing too little money. The only thing more shocking than 30-year gilts plunging from £59 last week to £42 this week before rebounding to £54 on BoE flip-flopping from QT back to QE was 45-year inflation protected gilts making a £110 to £40 to £98 roller coaster ride. The catalyst for the declines was a combination of UK fiscal expansion in an environment of the BoE about to begin QT. Surely US QT revving up also played a role. Amplifying the declines was pensions in the UK - and elsewhere in the world - receiving margin calls as they suffered severe mark-to-market losses from positions receiving fixed on interest rate swaps. That meant selling what they could - including gilts - creating a death spiral via further mark-to-market losses. Hence the BoE blinked.
Canary in the coal mine. We have been amazed by the lack of blowups this year despite very large price declines due to the hawkish shift in global central bank monetary policies - mostly blowups have been centered around crypto. While aspects of the UK situation are somewhat idiosyncratic, for us it represents the canary in the coal mine of much more to come in the new area of QT. Very simply there will be too many bonds chasing too little money and unwinds - which means investors shedding sovereign exposure and US IG corporate bonds (especially banks) - because they can, as other markets are less liquid.
Pain in the core. With blowups, the European peripheral sovereign crisis returning and the risk of economic depression in the core of the Eurozone on the back of the energy crisis - in particular in Germany thinly capitalized European banks represent considerable systemic risks to the global financial system. While we currently do not have a funding crisis the lack of funding for sovereign assets is merely a reflection of extreme price volatility in the space - European banks risk bringing back that aspect of the financial crisis.
Risks skewed toward wider spreads. Our 200bps, 800bps, 225bps and 850bps spread targets for US IG and HY and their EUR counterparts, respectively, now appear conservative as they represent merely recession-type levels. With blowups and systemic issues in the European banking system the distribution of outcomes for spreads around our targets is skewed decidedly toward the wider side.
Negative hedged relative yields. USD hedging costs have rapidly increased over the past month on hawkish Fed expectations relative to many global central banks. For JPY investors, 12-month hedging costs have risen to a record high of 4.8%, meaning the hedged yield in IG credit is significantly lower than nominal yields. Adding further are JGB 30-year yields at 1.4%, meaning the hedged relative value in US IG is actually negative. Coupled with currency weakness, we expect selling from foreign investors looking to lock in gains on unhedged exposure to USD bonds.”
CONCLUSION
In conclusion, we would like to point to the divergence between the Federal Reserve’s dot plot guidance of a terminal rate of around 4.6% to a market-driven Federal funds futures rate of 4.4%. This variance implies that the market expects that the Fed may not raise rates as aggressively as the guidance indicates. The reason this is important is not only the divergence but how it relates to global economic weakness and the financial market weakness. If there is continued weakness, the Fed may be forced to back off its current aggressive stance. The Bureau of Economic Indicators still points to strong American economic indicators in terms of inflated Core Personal Consumption Expenditures driven by higher service sector prices and a strong US Labor market. We’ll continue to watch these signals closely to understand how this may ultimately impact rates over time.
.png?width=660&name=signature%20block%20(3).png)
IMPORTANT DISCLOSURES
The information and statistics contained in this report have been obtained from sources we believe to be reliable but cannot be guaranteed. Any projections, market outlooks or estimates presented herein are forward-looking statements and are based upon certain assumptions. Other events that were not taken into account may occur and may significantly affect the returns or performance of these investments. Any projections, outlooks or assumptions should not be construed to be indicative of the actual events which will occur. These projections, market outlooks or estimates are subject to change without notice.
Please remember that past performance may not be indicative of future results. Different types of investments involve varying degrees of risk, and there can be no assurance that the future performance of any specific investment, investment strategy, or product or any non-investment related content, made reference to directly or indirectly herein will be profitable, equal any corresponding indicated historical performance level(s), be suitable for your portfolio or individual situation, or prove successful. Due to various factors, including changing market conditions and/or applicable laws, the content may no longer be reflective of current opinions or positions.
All indexes are unmanaged, and you cannot invest directly in an index. Index returns do not include fees or expenses. Actual portfolio returns may vary due to the timing of portfolio inception and/or investor-imposed restrictions or guidelines. Actual investor portfolio returns would be reduced by any applicable investment advisory fees and other expenses incurred in the management of an advisory account.
You should not assume that any discussion or information contained herein serves as the receipt of, or as a substitute for, personalized investment advice from City Different Investments. To the extent that a reader has any questions regarding the applicability above to his/her individual situation or any specific issue discussed, he/she is encouraged to consult with the professional advisor of his/her choosing. City Different Investments is neither a law firm nor a certified public accounting firm and no portion of this content should be construed as legal or accounting advice.
A copy of City Different Investments' current written disclosure statement discussing our advisory services and fees is available for review upon request.
Unless otherwise noted, City Different Investments is the source of information presented herein.
A description of the indices mentioned herein are available upon request.