.png)

WEEK ENDING 10/14/2022
Highlights of the week:
- CPI well ahead of consensus and sticky inflation guarantee a November rate hike, with another potential hike in December.
- Probability of recession in next twelve months is flashing higher.
- Q3 earnings season kicks off with cutback in expectations.
A CITY DIFFERENT TAKE
Meeting minutes from last week show that Federal Reserve officials are worried about undershooting inflation rather than overshooting. This month’s Consumer Price Index report brought numbers we haven’t seen since August 1982. Headline CPI stands at 8.2% YoY and Core CPI stands at 6.6%.
An increase in rent is the strongest culprit for unrelenting increases. Housing figures, which make up 40% of Core CPI, reflect higher rent prices across the country. The consumer “basket of goods” and medical indicators are also high.
From City Different Investment's point of view, we remain convinced that the Federal Reserve will continue down its path of battling inflation through rate increases. Remember, there is a lag between monetary policy and its effect on the real economy. We believe that the Fed must see a material decline in inflation prints. The terminal rate will end up closer to 4.6%. We are anticipating a 75-bps rate hike announced at the November meeting (this would be a third 75-bps rate increase this year) and another 50-to-75-bps hike in December.
In Quantitative tightening news, the Treasury runoff at $60 billion per month and the Mortgage Back securities runoff at $22.5 billion a month will run through the end of the year.
In light of all of the above, the probability of a U.S. recession in the next 12 months now stands at 60% (according to Bloomberg’s monthly survey of economists). A survey of U.S. CEOs shows a sanguine sentiment, with about 98% bracing for a recession. There is a growing view that an inflation “soft landing” will be much harder for the Fed to pull off. There is deterioration in a broad range of leading economic indicators, such as housing permits. With high rates and tightened financial conditions, housing permits are sharply down.
Q3 earnings season began with bank earnings last Friday. This season starts with reduced expectation. According to a Bank of America note analyst, estimates are down by 7% (rather than a typical 4%) over the last three years. Of course, Wall Street is structured to run so that companies can meet or beat earnings expectations. For 2023 guidance, it is more important to listen to management teams and their outlook for navigating a very strong dollar and tightening financial conditions.
CHANGES IN RATES
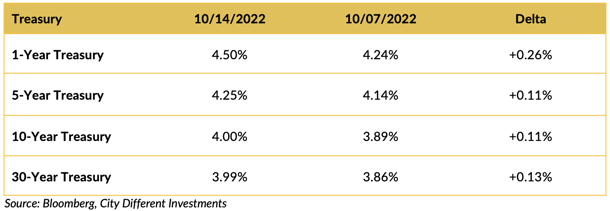
Interest rates in the Treasury moved higher in a holiday-shortened week. The short end of the yield curve led the way higher. Persistently strong inflation data, CPI and PPI, have given the Fed no reason to pivot from its inflation-fighting agenda.
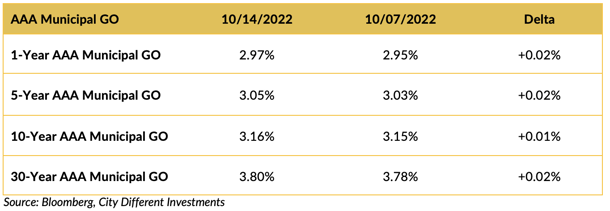
The holiday-shortened week meant low new-issuance volume of municipal bonds and little reason for interest rates in the municipal market to react to the new data (despite continued negative cash flows in municipal bond mutual funds). If history plays out, interest rates in the municipal market will react this week, led by new issuance pricing. Expected new issuance this week is in excess of $10 billion (see below).
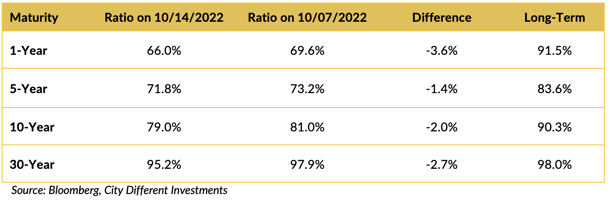
Ratios versus the Treasury market equivalents moved lower over the week.
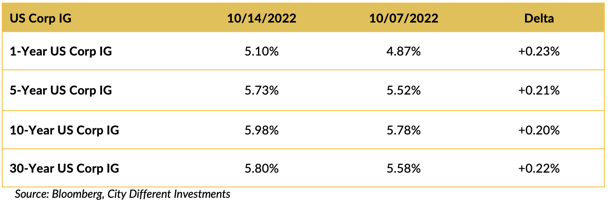
Investment-grade rates marched higher led by the short end of the yield curve.
THIS WEEK IN WASHINGTON

President Biden has been quoted as saying he is not worried about the strong U.S. dollar, noting the U.S. economy is “strong as hell.” His current concerns lie with the rest of the world.
This contrasts with an earlier view of financial pundits on the chances of a U.S. recession. The upcoming midterm elections should show if voters agree with the president or not.
WHAT, ME WORRY ABOUT INFLATION?
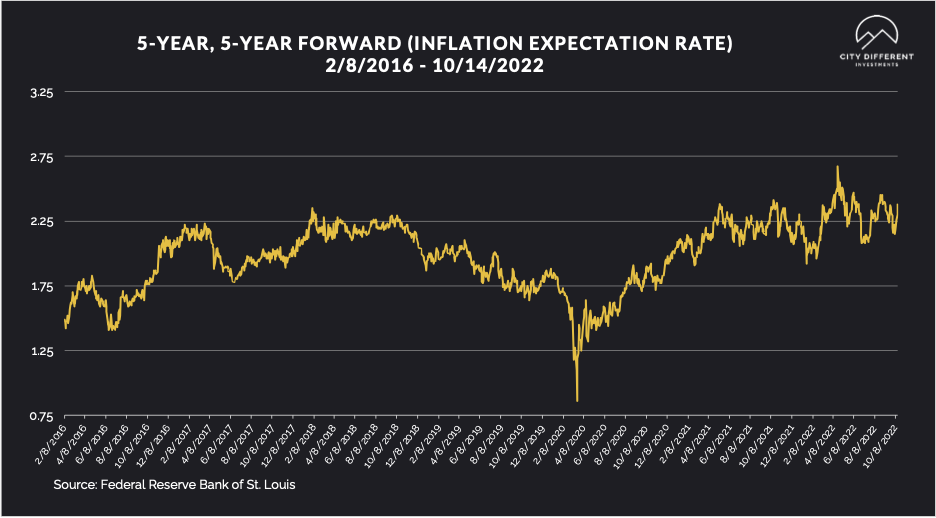
After persistently higher CPI and PPI readings. The 5-year Breakeven Inflation Rate ended at 2.28%%, 20 basis points higher than the prior week closing at 2.18%. The 10-year Breakeven Inflation Rate ended the week period at 2.41%, 14 basis points higher than the last reported observation of 2.27%. Both readings seem low, given where inflation is today.
MUNICIPAL CREDIT
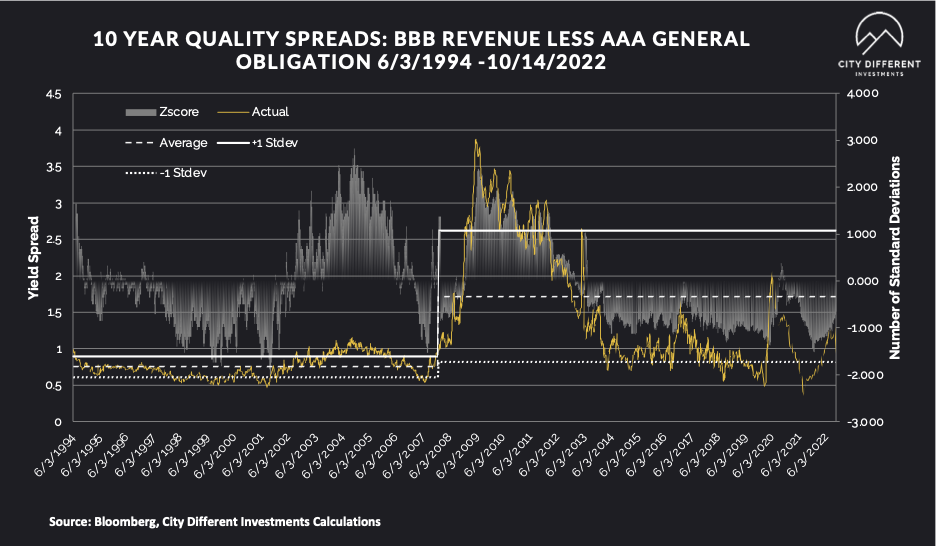
Quality spreads continued to widen, moving further into the fair range, and are starting to pique our interest. While we don’t think the move has been significant enough to change our strategic outlook towards credit, it's getting close.
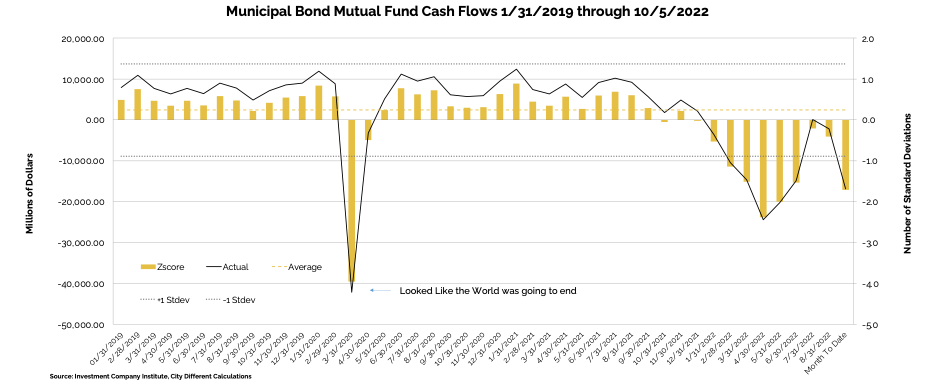
WHY IS THE MUNICIPAL MARKET BEHAVING THIS WAY?
Various sources are used to report cash flows related to municipal bond mutual funds and ETFs, all reporting at different times. The source we have chosen to use is the Investment Company Institute (I.C.I.). The I.C.I. reported weekly cash flows from municipal bond mutual funds for the week of October 5 as -$5.1 billion compared to -$5.4 billion from the week before.
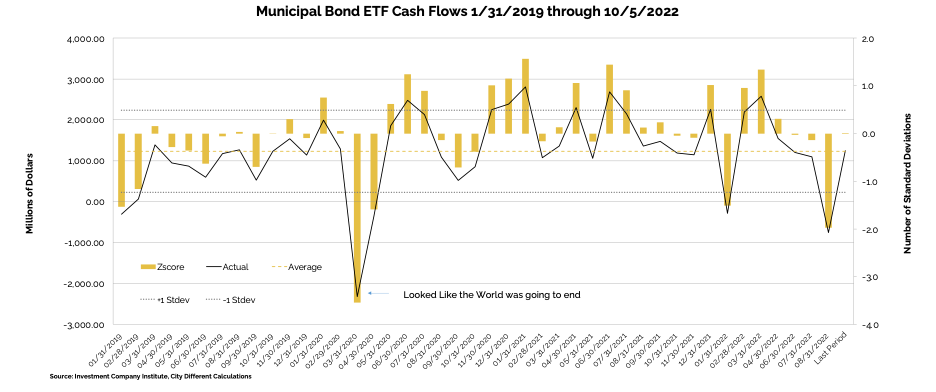
Municipal bond ETF cash flows for the same period were +$1.9 billion, compared to -$292 million the prior week.
Other cash flow sources:
Lipper reported a tenth consecutive combined weekly and monthly outflow, with $5.8 billion leaving Muni funds for the period ending October 12, marking the largest combined weekly and monthly outflow since the period ending June 8 ($8.2 billion). YTD outflows have now increased to a record $100.4 billion and full cycle inflows to $101.4 billion. High Yield funds recorded $539 million of outflows, Intermediate funds saw $1.4 billion of outflows, and Long-Term funds saw $2.5 billion of outflows. Municipal ETFs registered $842 million of inflows.
SUPPLY OF NEW ISSUE MUNICIPAL BONDS
In its Municipal Markets Weekly newsletter, JP Morgan commented on the supply picture this week, stating that:
“Next week, we expect total supply of $10.3 billion, elevated versus recent weeks but still 72% of the 5-year equivalent week average ($14.4 billion). We anticipate tax-exempt supply of $8.3 billion (84% of average), and taxable/corp cusip supply of $2.1 billion (43% of the average).”
The supply picture does not get interesting until it exceeds $10 billion tax-exempt issuances in a given week.
CORPORATE INVESTMENT GRADE AND HIGH YIELD OVERVIEW
In U.S. Investment Grade land, spreads widened slightly to reflect the pushback from the strong U.S. CPI data.
In its weekly "Credit Flows" report, Wells Fargo commented:
“The long and short of positioning. Thursday’s spectacular reversal in equities in response to higher than expected CPI inflation highlights positioning was super-bearish heading into the number. Specifically stocks initially declined more than 3% — the right reaction — only to finish the day up more than 2%, suggesting massive short covering. This highlights that perhaps the biggest enemy of our bearish outlook for corporate bonds is consensus — but we would suggest that sometimes consensus works.
What’s priced in credit? Loosely we think fair US IG credit spreads in an environment of little recession risk and QT are around 125bps and that in an actual recession — without other crises — they should be more like 200bps. That means at 163bps US IG is pricing in about a 50% chance of recession. For US HY we think 440bps is fair value with little recession risk and in a recession scenario 800bps is reasonable compensation. Currently at 527bps that implies the HY market is pricing a 28% recession probability. In our opinion both IG and HY are way too optimistic about the US economy and note economist consensus now pegs the probability of recession at 60%. In either case the US corporate credit market is not adequately pricing recession risk. On top of that there are numerous other risks.
Expensive relative to other assets. One of the key relationships we keep monitoring is credit spreads vs. related measures of uncertainty like equity and rates vol. Currently credit screens very rich to these other asset classes as fair value is pegged at 189bps and 600bps vs 163bps and 528bps currently for IG and HY, respectively. For US leveraged loans the fitted value is $89.70 vs. $92.15 currently. Even though EUR credit is cheap relative to their US counterparts they too screen expensive relative to equities and rates with fair values at 318bps and 828bps compared to 231bps and 622bps currently for IG and HY, respectively.
More inversion of 10s/30s in US IG. We are looking for the 10s/30s spread curve in US IG to further invert as we expect wider credit spreads and higher treasury yields. Historically wider spreads lead to flatter and eventually inverted 10s/30s curves as credit risk takes precedence over term premium during periods of market stress. In addition, long-end corporates have a steady demand base in the form of liability-driven investors such as insurance companies and pension plans, and thus tend to outperform when interest rates go up. Note that currently the 10s/30s curve is excessively flat versus the trend line as dollar prices of long-end corporates are at historic lows. Also note we define 10s as 7-10 year and 30s as 10+ year.”
CONCLUSION
The probability of a U.S. recession in the next 12 months is at an all-time high.
CPI headline and core inflation figures continue to flummox the Fed and their attempt at taming inflation. Those numbers are fueled by rising housing costs (i.e., rent) and consumer goods squeezes. While the president does not seem to think the dollar is weakening, voters might disagree in the upcoming midterm elections.
.png?width=660&name=signature%20block%20(3).png)
IMPORTANT DISCLOSURES
The information and statistics contained in this report have been obtained from sources we believe to be reliable but cannot be guaranteed. Any projections, market outlooks or estimates presented herein are forward-looking statements and are based upon certain assumptions. Other events that were not taken into account may occur and may significantly affect the returns or performance of these investments. Any projections, outlooks or assumptions should not be construed to be indicative of the actual events which will occur. These projections, market outlooks or estimates are subject to change without notice.
Please remember that past performance may not be indicative of future results. Different types of investments involve varying degrees of risk, and there can be no assurance that the future performance of any specific investment, investment strategy, or product or any non-investment related content, made reference to directly or indirectly herein will be profitable, equal any corresponding indicated historical performance level(s), be suitable for your portfolio or individual situation, or prove successful. Due to various factors, including changing market conditions and/or applicable laws, the content may no longer be reflective of current opinions or positions.
All indexes are unmanaged, and you cannot invest directly in an index. Index returns do not include fees or expenses. Actual portfolio returns may vary due to the timing of portfolio inception and/or investor-imposed restrictions or guidelines. Actual investor portfolio returns would be reduced by any applicable investment advisory fees and other expenses incurred in the management of an advisory account.
You should not assume that any discussion or information contained herein serves as the receipt of, or as a substitute for, personalized investment advice from City Different Investments. To the extent that a reader has any questions regarding the applicability above to his/her individual situation or any specific issue discussed, he/she is encouraged to consult with the professional advisor of his/her choosing. City Different Investments is neither a law firm nor a certified public accounting firm and no portion of this content should be construed as legal or accounting advice.
A copy of City Different Investments' current written disclosure statement discussing our advisory services and fees is available for review upon request.
Unless otherwise noted, City Different Investments is the source of information presented herein.
A description of the indices mentioned herein are available upon request.