.png)

WEEK ENDING 10/07/2022
Highlights of the week:
- Hurricane Ian beat up Florida.
- On the whole, state and local governments are coming into the economic slowdown with solid finances.
- The Federal Reserve is still hawkish; last week’s economic reports gave them no reason to change.
A CITY DIFFERENT TAKE
Interest rates continued to move higher last week based on more hawkish pronouncements from Fed officials and economic reports showing no reason for the Fed to reverse course. The fact that the OPEC+ “cartel” chose to decrease oil production by 2 million barrels did not help. Some view this decision as a slap in the face of America, but we are not so sure.
The United States has long been Saudi Arabia's primary security partner. Is that relationship about to change? Well, let’s look at the alternatives.
Would Russia make a better security partner? Just look at how well they are doing in Ukraine. Would China make a better partner? The Chinese government is having trouble with its zero-Covid policy and its real estate industry. If the Saudi government wants to keep its population happy (a key to survival), it should focus on its economic interests. That would mean focusing on either United States or Russia, which now has an economy the size of Italy’s and shrinking. (If China is thinking about a Taiwan invasion, events in Ukraine may give them pause.)
It appears that investors should get ready for more volatility. They should also remember that volatility is not the same as illiquidity. Volatility means that transactions take place at wider spreads and wildly fluctuating prices. Illiquidity means that transactions don’t take place at all.
CHANGES IN RATES
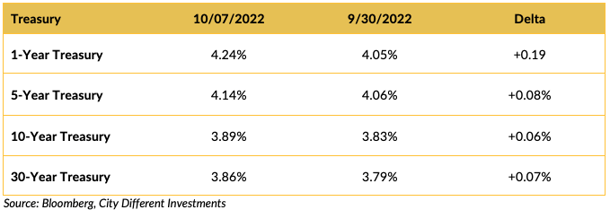
Interest rates in the Treasury moved higher last week. The short end of the yield curve led the way higher. More forceful rhetoric from Fed officials and an employment report that contain for the Fed to change its position on increasing interest rates were the leading contributors to the move.
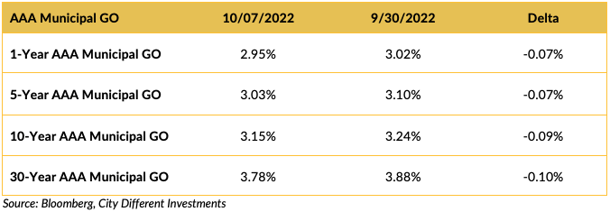
Interest rates in the municipal market moved lower last week, contrary to the other two fixed-income market segments we follow in the report. No doubt the result of a smaller new issue calendar. The slope of the 1-to-30-year yield curve did not change much over the week.
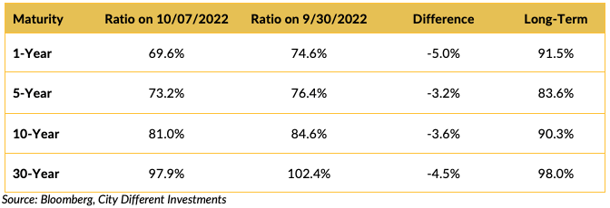
Ratios versus the Treasury market equivalents moved lower over the week. A higher M/T ratio tends to make Munis a more attractive buy.
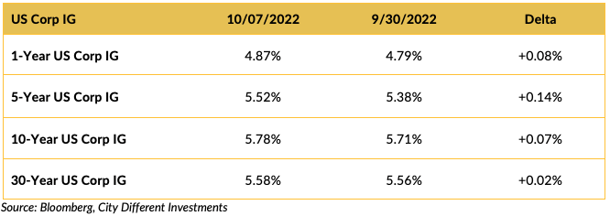
Investment-grade rates marched higher, led by the short end of the yield curve.
THIS WEEK IN WASHINGTON

With the midterm elections only four weeks away, most of the focus from Washington is on congressional campaigns. That said, we did learn a couple of things last week that we can enter into our ledger. (The reader can determine on which side of the ledger these observations belong.)
- Hurricane Ian unleashed torrents of destruction on Florida. President Biden and Governor DeSantis seemed to put political differences aside to tour and discuss recovery efforts. This devastation can be viewed as more evidence of the need to combat climate change.
- We learned President Biden thinks, “We have not faced the prospect of Armageddon since Kennedy and the Cuban Missile Crisis,” as a result of Russia’s military performance in Ukraine. AP News
- Governor DeSantis, Nancy Sinatra wants her white boots back. They may be made for walkin’ — but not on you.

The state campaigns are interesting, scary, and entertaining all at the same time. Races in Arizona, Ohio, and Pennsylvania all match that description. And the Senate race between Herschel Walker and Sen. Raphael Warnock, to quote Ray Charles, “keeps Georgia on my mind.” The idiocy has even reached the Governor’s race here in New Mexico — but that’s a topic for another day.
WHAT, ME WORRY ABOUT INFLATION?
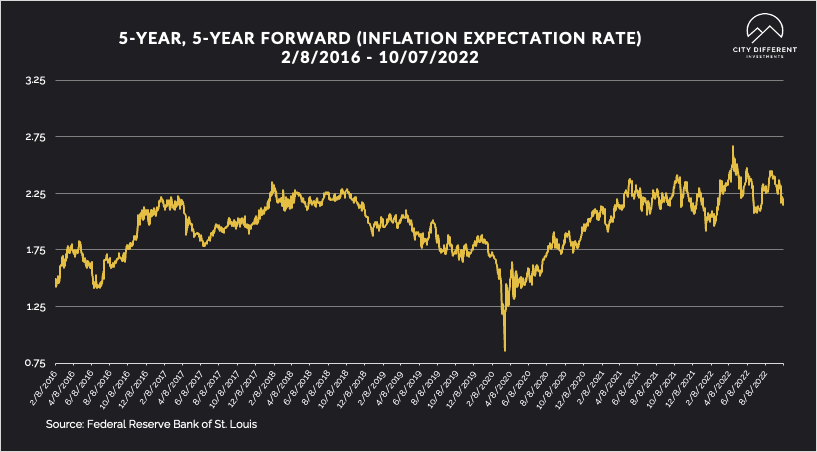
The 5-year Breakeven Inflation Rate ended at 2.18%, 2 basis points higher than the prior week closing at 2.16%. The 10-year Breakeven Inflation Rate ended at 2.27%, 12 basis points lower than the last reported observation of 2.15%. Both readings seem low, given where inflation is today.
MUNICIPAL CREDIT
At City Different Investments, we commit to providing an unvarnished opinion of the markets. There is no doubt that we are starting to see volatility in both the fixed-income and equity markets alike; however, we do not want to sound alarmist about the health of the municipal credit markets that continue to remain robust.
State and local governments are coming into the economic slowdown with solid finances. For example, the real estate boom has aided strong property tax collection. This is a reminder that there is a lag effect on certain things, such as this collection. Most issuers have financed projects during a low interest rate environment and are now sitting on strong balance sheets.
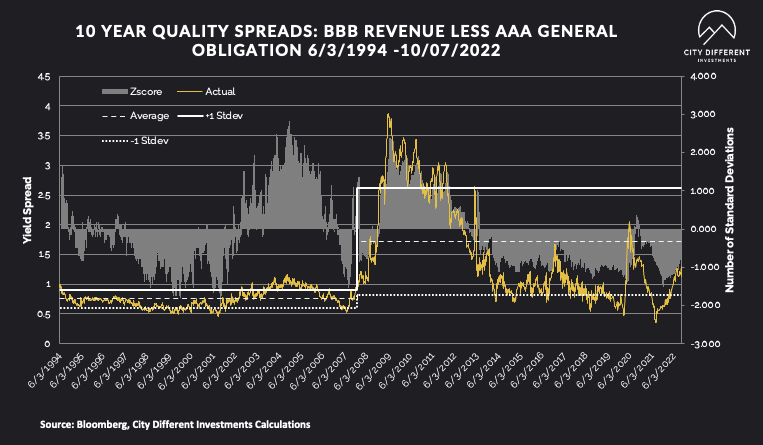
Quality spreads continued to widen, moving further into the fair range, and are starting to pique our interest. While we don’t think the move has been significant enough to change our strategic outlook towards credit, it's getting close.
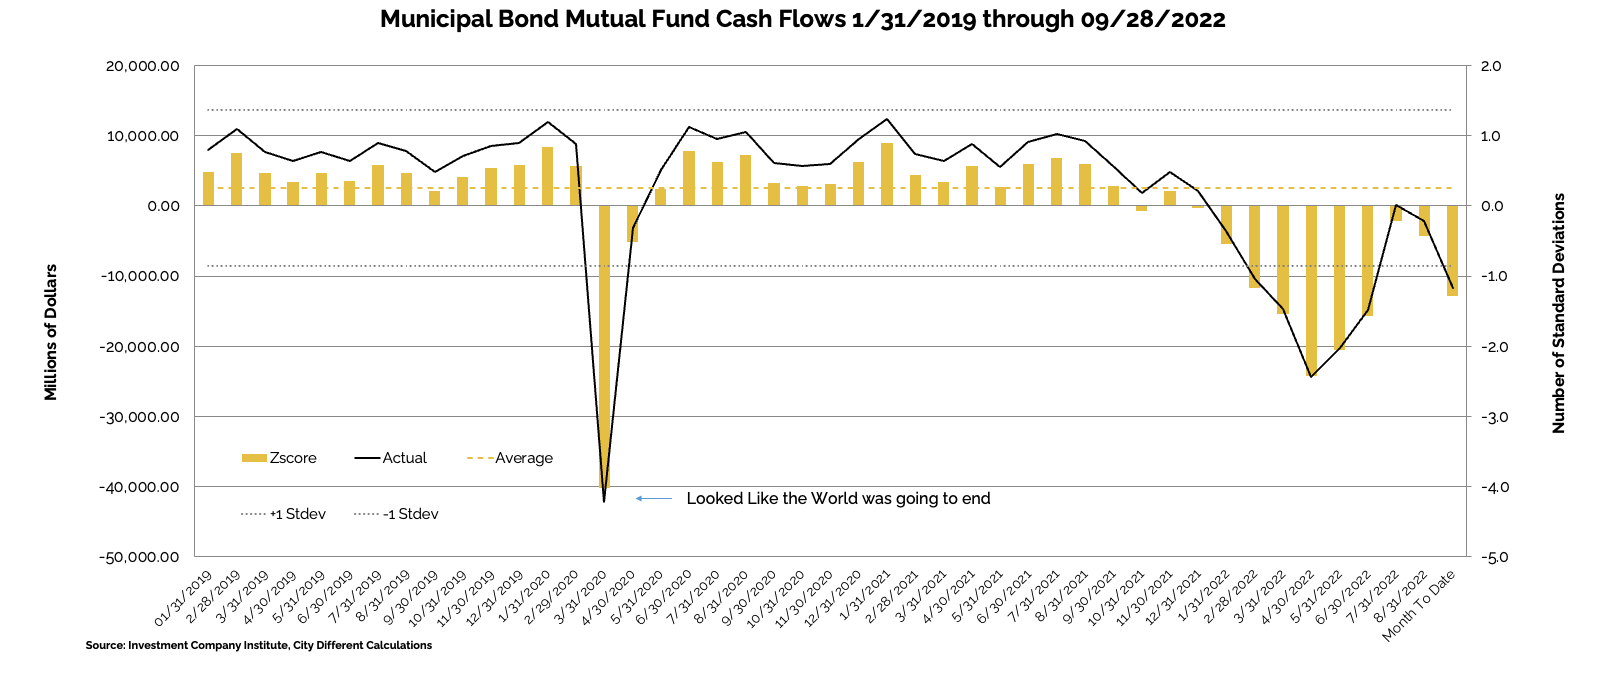
WHY IS THE MUNICIPAL MARKET BEHAVING THIS WAY?
Various sources are used to report cash flows related to municipal bond mutual funds and ETFs, all reporting at different times. The source we have chosen to use is the Investment Company Institute (I.C.I.). The I.C.I. reported weekly cash flows from municipal bond mutual funds for the week of September 28, as -$5.4 billion compared to -$2.7 billion from the week before.
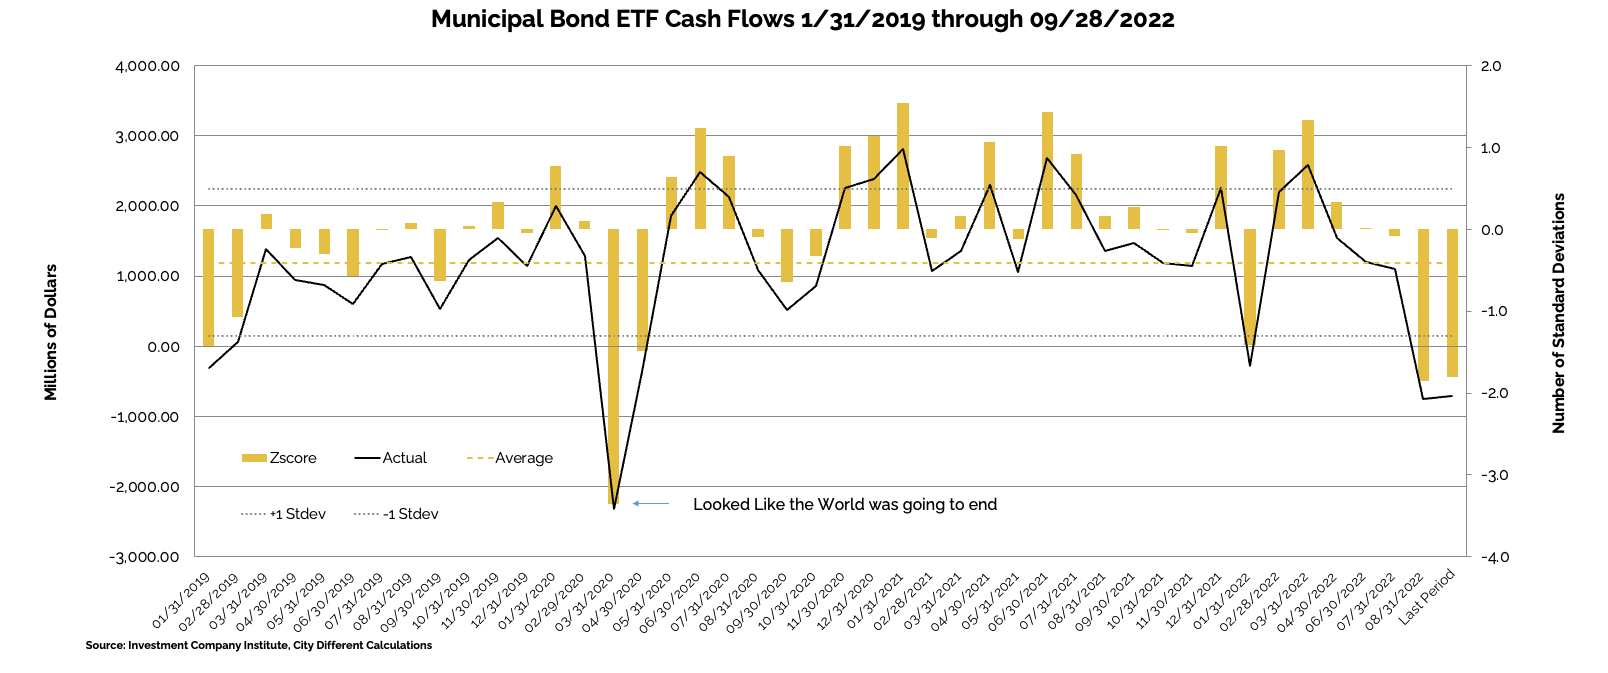
Municipal bond ETF cash flows for the same period were -$292 million, compared to -$492 million the prior week.
Other cash flow sources:
Lipper reported a 9th consecutive combined weekly and monthly outflow, with $3.1 billion leaving Muni funds for the period ending October 5, increasing record YTD outflows to $94.6 billion. High yield funds recorded $847 million of outflows, Intermediate funds saw $482 million of outflows, and Long term funds saw $2.1 billion of outflows. Municipal ETFs registered $1.1 billion of inflows.
SUPPLY OF NEW ISSUE MUNICIPAL BONDS
In its Municipal Markets Weekly newsletter, JP Morgan commented on the supply picture this week, stating that:
“In next week’s holiday shortened session, we expect total supply of just $2.2 billion, or 22% of the 5-year equivalent holiday week average ($9.9 billion). We anticipate tax-exempt supply of $2 billion (29% of average), and taxable/corp cusip supply of just $0.2 billion (6% of average).”
The supply picture does not get interesting until it exceeds $10 billion tax-exempt issuances in a given week.
CORPORATE INVESTMENT GRADE AND HIGH YIELD OVERVIEW
In U.S. Investment Grade land, spreads widened slightly to reflect the pushback from the strong U.S. CPI data.
In its weekly "Credit Flows" report, Wells Fargo commented:
"Broad based outflows is the theme for yet another week, albeit at a slower pace than in prior week. US IG and Leveraged Loans saw outflows of $3.0 billion and $0.9 billion, respectively, while US HY was an outlier with $0.8 billion in inflows. Euro IG, Euro HY, and EM reported outflows of $2.1 billion, $0.2 billion, and $3.8 billion, respectively. Issuance was spotty with $6.8 billion in US IG and €9.9 billion in Euro IG, while US and Euro HY were dormant. As of the prior week, dealers decreased their long positioning in US IG to $5.8 billion, and trimmed their net short in US HY to $0.3 billion."
CONCLUSION
Volatility is high, but markets are still functioning. Volatility can also lead to opportunities. This quarter is the first time in a long while that the fixed-income managers at City Different Investments are getting excited about the long-term return prospects for fixed-income assets.
.png?width=660&name=signature%20block%20(3).png)
IMPORTANT DISCLOSURES
The information and statistics contained in this report have been obtained from sources we believe to be reliable but cannot be guaranteed. Any projections, market outlooks or estimates presented herein are forward-looking statements and are based upon certain assumptions. Other events that were not taken into account may occur and may significantly affect the returns or performance of these investments. Any projections, outlooks or assumptions should not be construed to be indicative of the actual events which will occur. These projections, market outlooks or estimates are subject to change without notice.
Please remember that past performance may not be indicative of future results. Different types of investments involve varying degrees of risk, and there can be no assurance that the future performance of any specific investment, investment strategy, or product or any non-investment related content, made reference to directly or indirectly herein will be profitable, equal any corresponding indicated historical performance level(s), be suitable for your portfolio or individual situation, or prove successful. Due to various factors, including changing market conditions and/or applicable laws, the content may no longer be reflective of current opinions or positions.
All indexes are unmanaged, and you cannot invest directly in an index. Index returns do not include fees or expenses. Actual portfolio returns may vary due to the timing of portfolio inception and/or investor-imposed restrictions or guidelines. Actual investor portfolio returns would be reduced by any applicable investment advisory fees and other expenses incurred in the management of an advisory account.
You should not assume that any discussion or information contained herein serves as the receipt of, or as a substitute for, personalized investment advice from City Different Investments. To the extent that a reader has any questions regarding the applicability above to his/her individual situation or any specific issue discussed, he/she is encouraged to consult with the professional advisor of his/her choosing. City Different Investments is neither a law firm nor a certified public accounting firm and no portion of this content should be construed as legal or accounting advice.
A copy of City Different Investments' current written disclosure statement discussing our advisory services and fees is available for review upon request.
Unless otherwise noted, City Different Investments is the source of information presented herein.
A description of the indices mentioned herein are available upon request.