.png)

WEEK ENDING 1/6/2023
Highlights of the week:
- Happy New Year!
- 2023 starts with a strong December jobs report.
- The circus is in town, and that town is Washington, DC.
A CITY DIFFERENT TAKE
Since our last weekly commentary on December 16, interest rates have trended upward, shifting after an eye-opening employment report released on Friday.
The earlier JOLTS report showed more than 10 million jobs open, so we expected a relatively strong December jobs reading. And Friday’s jobs report was strong; the unemployment rate declined to 3.5% from an expected 3.7%, and the November unemployment rate was revised to 3.6% from 3.7%. The change in nonfarm payrolls (increasing by 223,000) beat expectations of 205,000, but the November number was revised down by 7,000 jobs.
The big surprise came from the M/M and Y/Y in average hourly earnings. Month over month, the increase was below expectations at 0.3%, and the November number was revised down to 0.4%. Likewise, the year-over-year numbers were below expectations at 4.6% (versus 5.0%), and the November readings were revised down to 4.8%. All this indicates that the Fed is winning the inflation battle. Some crosscurrents bring this conclusion into question. A recent CNBC article noted the difference in wage increases for those workers that stayed in their jobs versus switched jobs:
“The latest data shows job switchers have seen 7.7% wage growth as of November, while workers who have stayed in their jobs have seen 5.5%, noted Daniel Zhao, lead economist at Glassdoor, citing figures from the Atlanta Federal Reserve. However, workers may not be currently seeing wage bumps quite that big, due to the fact that data looks back over the past year, he noted. Higher pay has been needed to keep up with inflation. The consumer price index, a measure for a wide basket of goods and services, was up 7.1% in November compared to the previous year.”
The data is still varied, and one number does not a trend make. But for now, it looks like the Fed is winning, which will have ramifications for the February meeting. We remain skeptical — but our conviction is lessoning.
CHANGES IN RATES
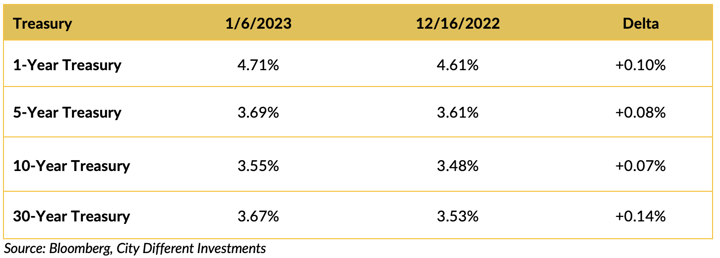
The chart above shows Treasury yields increasing over the period it covers. It doesn't show the volatility in the fixed-income markets over the holidays. Friday’s jobs report added to the volatility with a strong rally in Treasury yields after its release. The slope of the Treasury curve was virtually unchanged over the period.
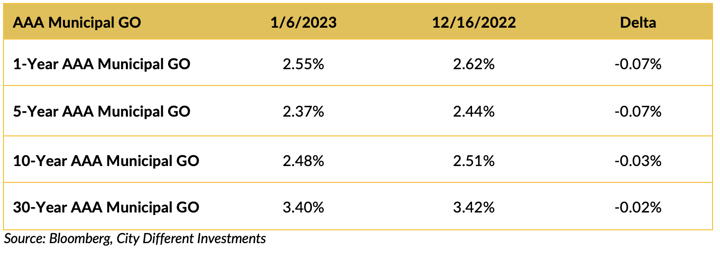
Yields in the municipal market moved slightly lower over the period. The municipal market did experience a strong rally after the jobs report release, 10 basis points on average across the yield curve.
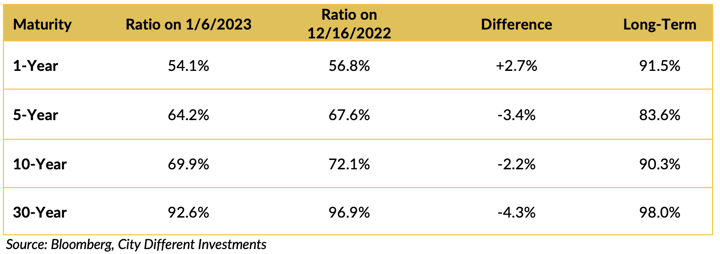
Most muni/Treasury ratios were lower over the period. Could this be the beginning of the long-awaited January effect? We continue to think market participants' enthusiasm for the potential of the January effect has gotten a little ahead of itself.
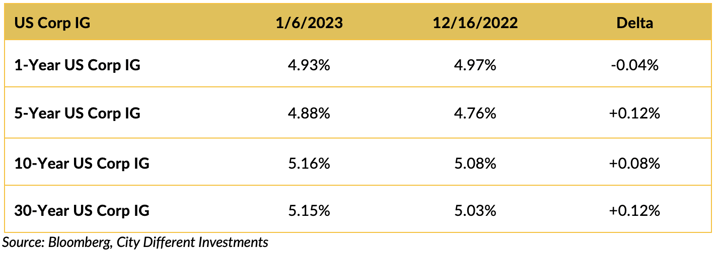
Investment grade yields moved higher over the period.
THIS WEEK IN WASHINGTON
.png?width=1920&name=graphs%20in%20order%20(1).png)
Ladies, gentlemen, and children of all ages (to borrow from the Ringling Bros. and Barnum & Baily) — the circus is in town!
After 15 rounds of voting, Kevin McCarthy was elected speaker of the U.S. House of Representatives. To paraphrase St. Mark, “For what shall it profit a man, if he shall gain the role (after he bargained away most of its power), and lose his own soul?” It hasn’t taken this many votes to elect a speaker since the 1850s, and we all know what followed soon after that.
On the bright side, we now know what will bring Republicans, Democrats, governors, senators, congresspeople, and even a president together. That is basking in the reflective glory of taking credit for a federally funded infrastructure bridge project on the Ohio-Kentucky border. We realize that the infrastructure in the U.S. needs work, and the multiplier effect of these projects may add to inflationary pressures, but the photo op was precious.
WHAT, ME WORRY ABOUT INFLATION?
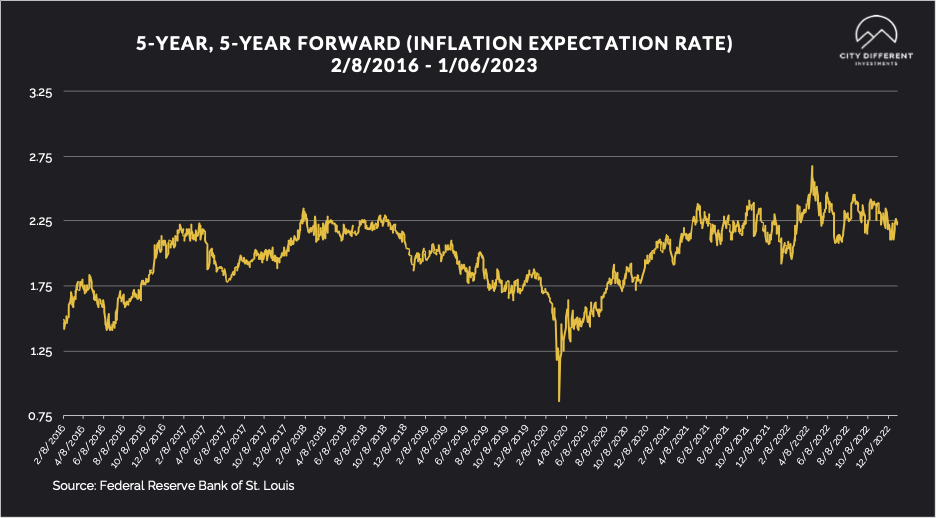
The 5-year Breakeven Inflation Rate ended Friday at 2.20%, 8 basis points higher than the December 16 closing of 2.12%. The 10-year Breakeven Inflation Rate ended the week at 2.21%, 8 basis points higher than the December 16 observation of 2.13%.
MUNICIPAL CREDIT
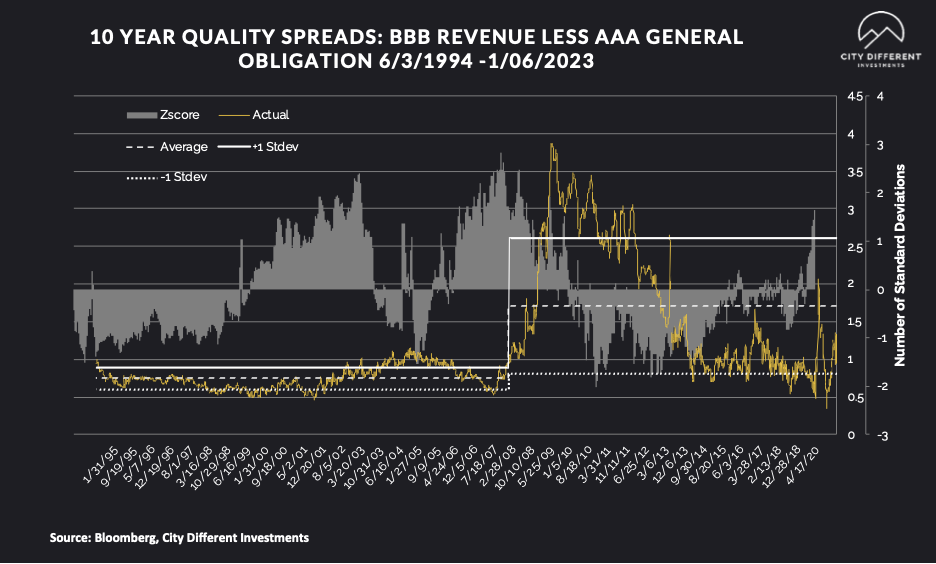 10-year quality spreads (AAA vs. BBB), as measured on January 6 were at 1.33%, higher than the December 16 reading of 1.26% and still below the long-term average of 1.72%. This reading is at the lower end of the fair territory (as we define it). We still do not think that investors are “getting paid” to take credit risk with forecasts of a recession on the horizon (even though we believe the likelihood of a significant recession is low). We would need quality spreads to move into the upper portion of the fair territory before beginning a strategic position.
A little credit tidbit from J.P. Morgan’s January 9, 2023, Municipal Morning Intelligence newsletter:
“In 2022, there were just $1.3 billion in bond defaults, down 32% from 2021 ($1.8 billion), and 31% lower than the three-year average. For distressed bonds, 2022 had a balance of $2.1 billion, down 21% from 2021, and 25% lower than the three-year average.”
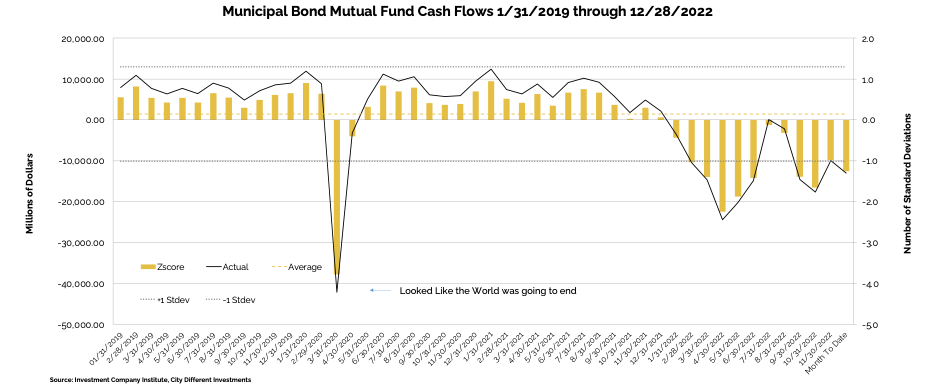
WHY IS THE MUNICIPAL MARKET BEHAVING THIS WAY?
Various sources are used to report cash flows related to municipal bond mutual funds and ETFs, all reporting at different times. The source we have chosen to use is the Investment Company Institute (I.C.I.). The I.C.I. reported weekly cash flows from municipal bond mutual funds of -$3.4 billion for the period ending December 28, compared to -$4.1 billion from the week of December 21.
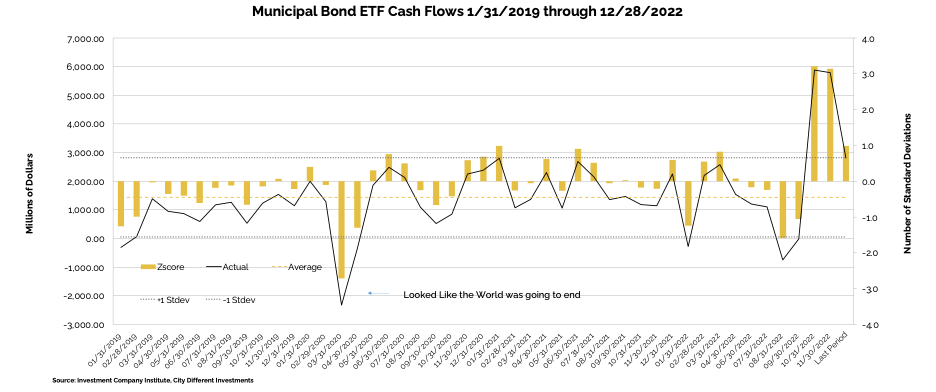
Municipal bond ETF cash flows for the same combined period were +$678 million, compared to -$531 million the week of December 21.
In its Municipal Morning Intelligence newsletter dated January 9, 2023, JP Morgan commented on cash flow data, stating that:
“Lipper reported combined weekly and monthly outflows of $2.0 billion, on ETF inflows of $1.3 billion, and open-end outflows of $3.3 billion. High-yield funds recorded $739 million, Intermediate $370 million, and Long-term funds saw $970 million of outflows.”
SUPPLY OF NEW ISSUE MUNICIPAL BONDS
The new issue municipal bond supply is still muted. We don’t expect it to pick up until the holiday fog retreats.
CORPORATE INVESTMENT GRADE AND HIGH YIELD OVERVIEW
In its weekly "Credit Brief" report dated January 6, 2023, Wells Fargo commented:
“Rates vs Recession. For 2022 and 2023 the big picture story playing out is 1) way too much inflation prompting 2) global central bank monetary policy tightening 3) pushing the economy into recession. Our view is that 1) and 2) created a rates shock in 2022 leading to underperformance of rates sensitive assets. For 2023 we are looking for a little bit of 2) remaining and then 3) – i.e. recession. Today’s data – while a bit confusing – supports this view, although implying a bit of a faster than expected transition away from rates risk toward recession risk.
First the jobs report for December showed Average Hourly Earnings (AHE) coming in below expectations (+0.3% MoM vs. +0.4%) as well as the prior month revised down (to +0.4% from +0.6%), which supports a view of less rates risk weighing on economic growth. On the other hand, wage growth remains unacceptably high, and with the unemployment rate falling back to a cycle low of 3.5% - despite a small increase in the labor force participation rate - that shows super-strong labor demand, which makes it difficult to return wage inflation – and thus overall inflation - to levels consistent with the Fed’s mandate.
Services not needed? While the jobs report was ambiguous and perhaps neutral for markets, ISM Services for December painted a strikingly negative picture of the US economy – coming in at contractionary 49.6 vs. 55 consensus and 56.5 the month prior– a huge disappointment. Although this print validates the part from the jobs report of lower wage inflation, it stands in sharp contrast to the decline in the unemployment rate. Taking together that validates today’s 2.2% rally in stocks although clearly we need more evidence before concluding there is less rates risk. None of this impacts our bearish outlook for 1H23 but shifts probabilities a bit.
4Q Earnings Preview. Ahead of the 4Q22 earnings reporting season starting next week consensus has US IG earnings growth of -0.6%, down from +3.6% in 3Q while revenue is estimated at +3.4% vs. +8.5% the prior quarter. The situation for US HY companies is similar with consensus 4Q22 earnings growth of -0.8% from +3.9% in 3Q and sales growth of +3.2% down from +9.5% the prior quarter. Of course, actual growth beats on average so we would expect to realize positive numbers. The most important change this time is we expect companies to issue negative guidance for 2023 both in the tech sector and beyond, which should be a headwind for credit spreads.”
CONCLUSION
The fixed income markets experienced a large rally on Friday based on the wage numbers in the jobs report. The curve is inverted, and most real yields are still negative for maturities longer than five years (based on backward-looking inflation readings). Implied inflation readings have not varied much from the 2% level for many months, so we are not sure how valid these readings are.
Our conviction on being short duration has been challenged (starting last November). This means that our account durations will be much closer to the midpoint than at any time in the last year.
The circus that is the House of Representatives will add to the concept that a divided government is good for the markets. We will see if that holds in 2023.
IMPORTANT DISCLOSURES
The information and statistics contained in this report have been obtained from sources we believe to be reliable but cannot be guaranteed. Any projections, market outlooks or estimates presented herein are forward-looking statements and are based upon certain assumptions. Other events that were not taken into account may occur and may significantly affect the returns or performance of these investments. Any projections, outlooks or assumptions should not be construed to be indicative of the actual events which will occur. These projections, market outlooks or estimates are subject to change without notice.
Please remember that past performance may not be indicative of future results. Different types of investments involve varying degrees of risk, and there can be no assurance that the future performance of any specific investment, investment strategy, or product or any non-investment related content, made reference to directly or indirectly herein will be profitable, equal any corresponding indicated historical performance level(s), be suitable for your portfolio or individual situation, or prove successful. Due to various factors, including changing market conditions and/or applicable laws, the content may no longer be reflective of current opinions or positions.
All indexes are unmanaged, and you cannot invest directly in an index. Index returns do not include fees or expenses. Actual portfolio returns may vary due to the timing of portfolio inception and/or investor-imposed restrictions or guidelines. Actual investor portfolio returns would be reduced by any applicable investment advisory fees and other expenses incurred in the management of an advisory account.
You should not assume that any discussion or information contained herein serves as the receipt of, or as a substitute for, personalized investment advice from City Different Investments. To the extent that a reader has any questions regarding the applicability above to his/her individual situation or any specific issue discussed, he/she is encouraged to consult with the professional advisor of his/her choosing. City Different Investments is neither a law firm nor a certified public accounting firm and no portion of this content should be construed as legal or accounting advice.
A copy of City Different Investments' current written disclosure statement discussing our advisory services and fees is available for review upon request.
Unless otherwise noted, City Different Investments is the source of information presented herein.
A description of the indices mentioned herein are available upon request.