

WEEK ENDING 1/27/2023
Highlights of the week:
- This is a big economic week, with a 25-bps rate hike baked in for Wednesday.
- A complex economic picture makes the Federal Reserve's job extremely difficult.
- 2% inflation could be a pre-pandemic target not quite ready for a post-pandemic world.
A CITY DIFFERENT TAKE
This is a big week for the release of economic data. Reports from Case-Shiller, ISM, ADP, and nonfarm payroll are all releasing this week. In addition, the Federal Reserve is set to meet January 31–February 1.
Inflation data has cooled down. The market has priced in a rate increase of 25 basis points. This would move the terminal rate target range to 4.5%–4.75%. We expect Chairman Powell to maintain the tone of “higher for longer.” Markets have already peaked the Fed Fund rate at 5%. Whether the terminal rate peaks at 5% or 5.25% will depend on the economic releases between this meeting and March, we expect.
The Fed is struggling with data and trends that point in different directions. While inflation is easing, supply chain disruptions are slowly resolving as well. All this is fantastic news for the Fed. But how does the Fed make sense of the still roaring labor market. To quote Chairman Powell “If wage growth stays as high as it has been, they will still have an inflation problem.” The other pressure is China reopening. What does that do to commodity prices? In addition, a milder winter and a better growth prospect in Europe would make the case for a 5.25% terminal rate.
We grew up with the Federal Reserve targeting a 2% inflation metric after the record-high inflation of the 1970s and ‘80s. Vice Chair Lael Brainard puts it best “Is 2% sort of a magical number? Probably not. But it’s our number, and we are very committed to bringing inflation back to 2%. (...) Achieving that target is just core to our overall monetary policy.”
The market, however, does not believe that this Fed will reach its North Star. Consensus is for a 5-year inflation outlook of 3%. In our section on inflation below you will see a 5-year breakeven currently at 2.33%.
CHANGES IN RATES
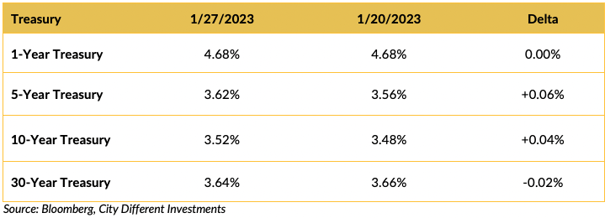
This was a very quiet week in the Treasury market, in spite of another inflation report that showed inflation declining. It seems that since the Fed officially entered its blackout period — the period prior to a meeting which bars officials from making public comments — the market must wait for next week's meeting for direction. It will be interesting to see if the Fed accommodates the market's view of a future economic slowdown. Or does the Fed disabuse the market of this theory and continue its fight against inflation by continuing to raise rates?
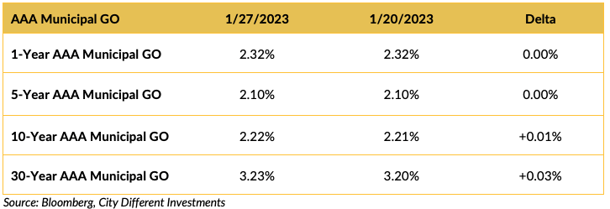
It was also a quiet week in the municipal market in spite of low new issuance levels. Yields in the municipal market were relatively unchanged on the week following the Treasury markets lead.
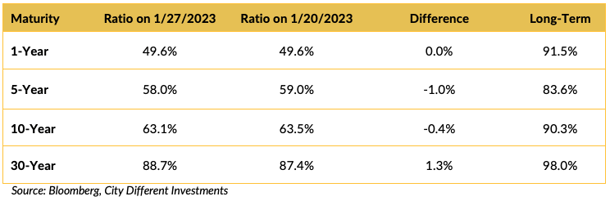
All quiet on the ratio front. No surprise.
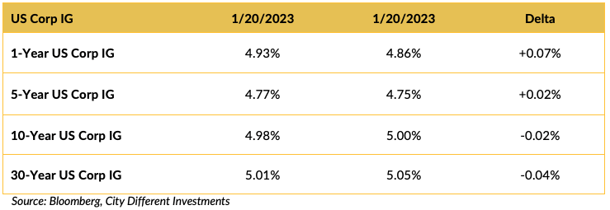
Another fixed income market awaiting the results of next week’s Fed meeting.
THIS WEEK IN WASHINGTON
.png?width=1920&name=graphs%20in%20order%20(1).png)
The debt limit bill is still being held hostage in Washington. Treasury Secretary Janet Yellen has been asking for an increase in the debt limit. But House GOP leaders have tied massive spending cuts to the bill, putting it in a precarious position. The House, however, could still pass a possible short-term bill to extend the debt ceiling.
In other news, the House passed a Strategic Production Response Act that would stop the Department of Energy from tapping the Strategic Petroleum Reserve (SPR) without a plan to increase leasing on Federal lands and water. President Biden vowed to veto this bill. Republicans, however, pointed to the release of 180 million barrels from SPR last year as a political move to lower gasoline prices before the November midterms.
WHAT, ME WORRY ABOUT INFLATION?
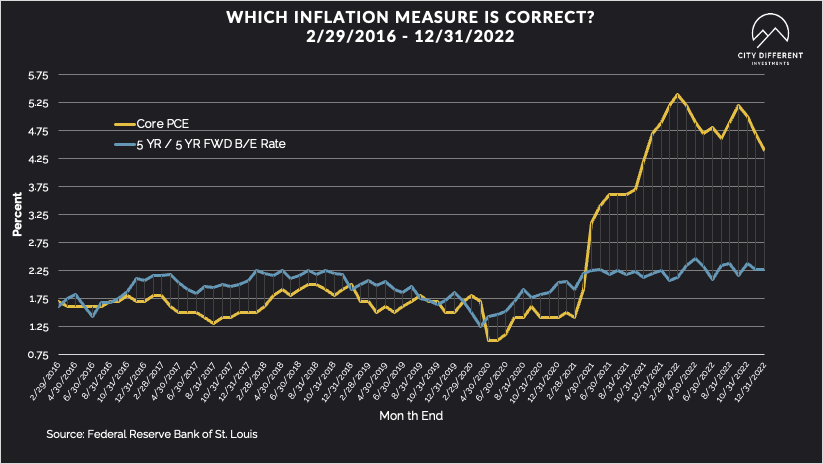
The 5-year Breakeven Inflation Rate ended Friday at 2.33%, ten basis points higher than the January 20 closing of 2.23%. The 10-year Breakeven Inflation Rate ended the week at 2.33%, ten basis points higher than the January 20 observation of 2.23%. There are no typos in this paragraph.
We have long been interested in the difference between the implied inflation rate between Treasury Inflation-Protected Securities (TIPS) and coupon-bearing Treasuries. The above graph highlights the difference between the 5-year Breakeven Rate and Core PCE. The big question is which one to believe. Especially since the 5-year Breakeven Rate doesn’t seem to react to changing economic conditions.
MUNICIPAL CREDIT
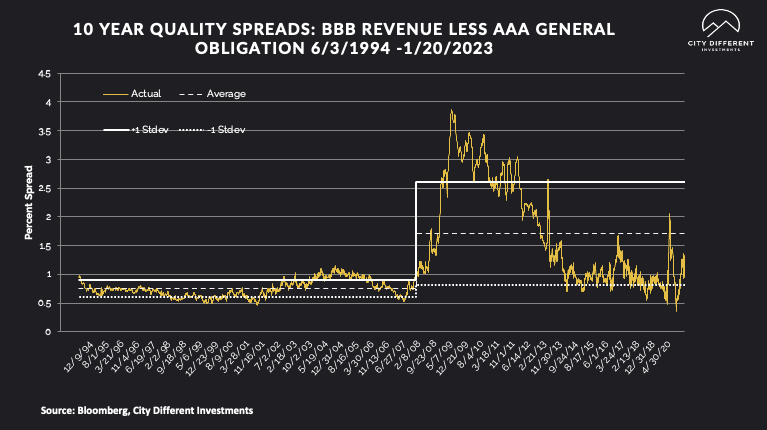
10-year quality spreads (AAA vs. BBB) were unchanged on the week, which is no real surprise given the lack of volatility.
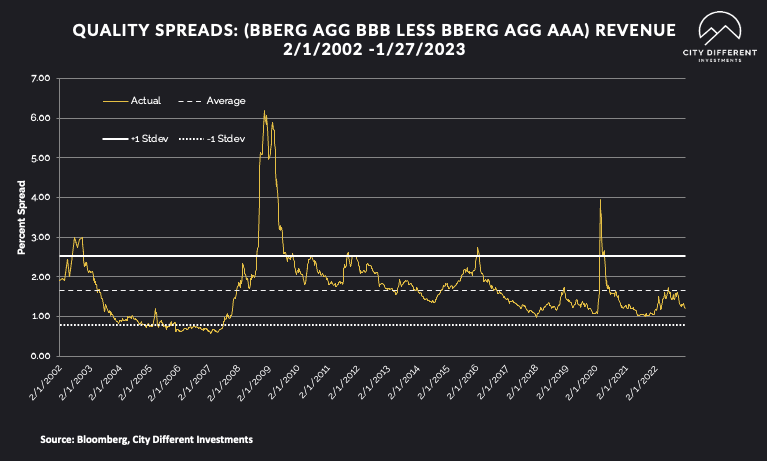
Both readings tell the same story; credit spreads are at the lower end of the fair range and not wide enough for CDI to take a strategic position. Given this week’s weak economic data, we feel these spreads are likely to widen in the future.
WHERE ARE FIXED-INCOME INVESTORS PUTTING THEIR CASH?
Fixed income inflows are ripping and roaring. With the highest inflows in cash management for obvious reasons. Investors are out with their shopping bags picking up fixed income products.
Money Market Flows (millions of dollars)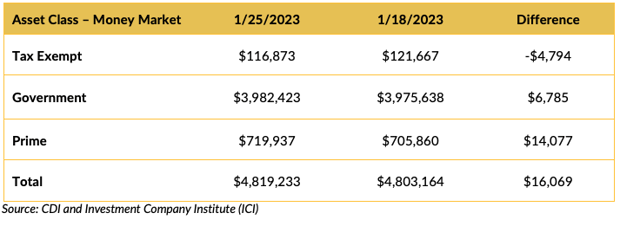
Investors look to be attracted to money market funds, enticed by the inverted yield curve’s alluring yields.
Mutual Fund Flows (millions of dollars)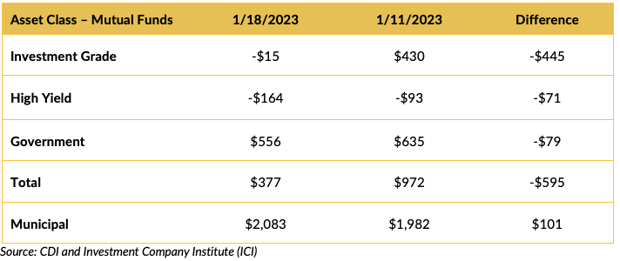
Some taxable bond funds lost money last week, but municipal bond mutual funds attracted more investor's cash flows. (The January effect continues.)
ETF Fund Flows (millions of dollars)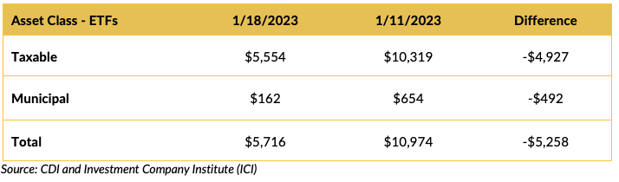
Although cash flows into bond ETFs slowed, the asset class seems to be gaining market share.
SUPPLY OF NEW ISSUE MUNICIPAL BONDS
We estimate that next week’s new issue supply will be low, around $550 million. Another sign that markets are awaiting the results of the Fed’s meeting.
Total new issuance supply figures of $10 billion or more usually indicate weakness in new issue supply pricing (higher yields).
CONCLUSION
This is an extremely important week for the fixed income markets. A plethora of economic data will be released; the most important news will be the outcome of the Fed meeting on Wednesday. The market has priced in a 25-bps rate hike. We are sympathetic to the Fed and the contradictory metrics it is seeing. Making policy must be challenging with these different data sources. But we also doubt that the Fed’s 2% inflation North Star will hold true in the post-pandemic new world order.
IMPORTANT DISCLOSURES
The information and statistics contained in this report have been obtained from sources we believe to be reliable but cannot be guaranteed. Any projections, market outlooks or estimates presented herein are forward-looking statements and are based upon certain assumptions. Other events that were not taken into account may occur and may significantly affect the returns or performance of these investments. Any projections, outlooks or assumptions should not be construed to be indicative of the actual events which will occur. These projections, market outlooks or estimates are subject to change without notice.
Please remember that past performance may not be indicative of future results. Different types of investments involve varying degrees of risk, and there can be no assurance that the future performance of any specific investment, investment strategy, or product or any non-investment related content, made reference to directly or indirectly herein will be profitable, equal any corresponding indicated historical performance level(s), be suitable for your portfolio or individual situation, or prove successful. Due to various factors, including changing market conditions and/or applicable laws, the content may no longer be reflective of current opinions or positions.
All indexes are unmanaged, and you cannot invest directly in an index. Index returns do not include fees or expenses. Actual portfolio returns may vary due to the timing of portfolio inception and/or investor-imposed restrictions or guidelines. Actual investor portfolio returns would be reduced by any applicable investment advisory fees and other expenses incurred in the management of an advisory account.
You should not assume that any discussion or information contained herein serves as the receipt of, or as a substitute for, personalized investment advice from City Different Investments. To the extent that a reader has any questions regarding the applicability above to his/her individual situation or any specific issue discussed, he/she is encouraged to consult with the professional advisor of his/her choosing. City Different Investments is neither a law firm nor a certified public accounting firm and no portion of this content should be construed as legal or accounting advice.
A copy of City Different Investments' current written disclosure statement discussing our advisory services and fees is available for review upon request.
Unless otherwise noted, City Different Investments is the source of information presented herein.
A description of the indices mentioned herein are available upon request.