.png)

WEEK ENDING 1/20/2023
Highlights of the week:
- Except for jobs figures, the latest wave of economic numbers indicate weakness.
- “Don’t Fight the Fed!” — with a “data dependent” strategy, our durations are moving closer to our neutral target based on uncertainty in the markets.
- This debt ceiling limit feels a little different than past debt ceiling limits.
A CITY DIFFERENT TAKE
This was a week of conflicting economic signals. Earlier in the week, several economic releases pointed to a slowdown in economic activity; the fixed income market rallied (lower yields). Later in the week, the weekly jobs data came in stronger than expected, not showing the same economic weakness. Throughout the week, a chorus of Fed officials joined in the same refrain. The Fed will continue to increase rates but at lower increments. Inflation is declining but has a long way to go to reach the Fed’s 2% target.
CHANGES IN RATES
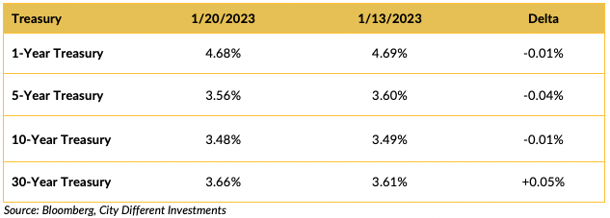
It was a wild week in the fixed income markets. Early in the week, we saw a raft of data released, which gave the markets a clear indication that the economy was weakening. This led to a rally (lower yields) across all sectors. The remainder of the week was filled with Fed speakers that reminded the markets about the Fed’s conviction to lower rate increases to achieve a higher terminal rate than the market anticipates for a longer period of time.
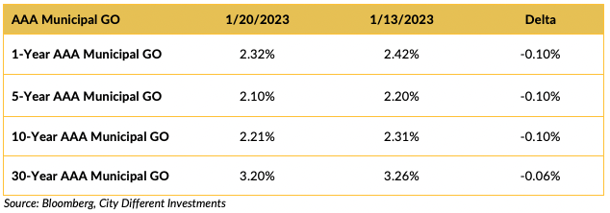
Yields in the municipal market continued to move lower over the period, and the January effect is taking hold despite more than $9 billion of new issue supply coming to market last week.
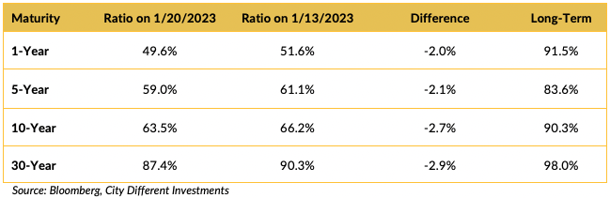
Most Muni/Treasury ratios were lower over the period (the third week in a row). The long-awaited January effect is here. Our skepticism is misplaced this year. The next question is how long will it last?
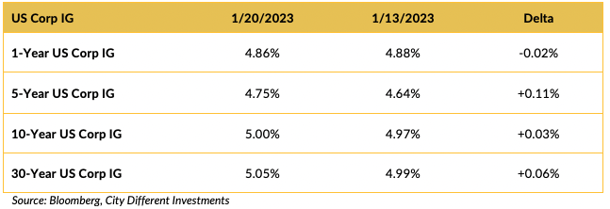
Investment grade yields were mixed last week.
THIS WEEK IN WASHINGTON
.png?width=1920&name=graphs%20in%20order%20(1).png)
We’ve been worried about writing this section all week. Washington in 2023 is proving to be a target-rich environment. Starting with the travails of George Santos (if that is his real name) to what seems to be a continuous drip of classified documents discovered at various Biden resting places.
Our major concern focuses on the debt ceiling. The markets are comfortably numb to the issue of the debt ceiling because usually, after much speechifying, the issue gets resolved. But the dynamics in the House of Representatives have radically changed. A small group of somewhat inexperienced firebrands (compliance will not let us call them clowns) now seems to control the majority party, and Kevin McCarthy has given away most of the speaker’s power to gain that title. So, our view is that the risk of a miscalculation has risen and that a miscalculation could have dire consequences. We do not want to panic our readers; although the risk has risen, we feel the risk is still quite small. What can an investor do? Brace for increased volatility.
WHAT, ME WORRY ABOUT INFLATION?
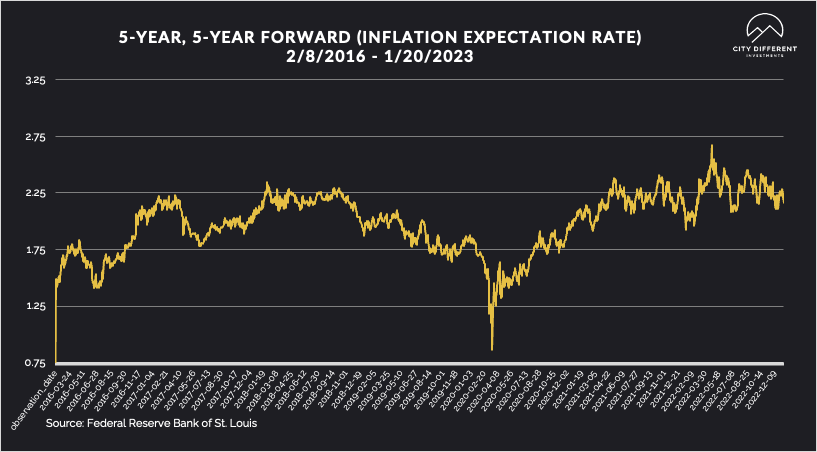
The 5-year Breakeven Inflation Rate ended Friday at 2.23%, 7 basis points higher than the January 13 closing of 2.16%. The 10-year Breakeven Inflation Rate ended the week at 2.23%, five basis points higher than the January 13 observation of 2.18%.
MUNICIPAL CREDIT
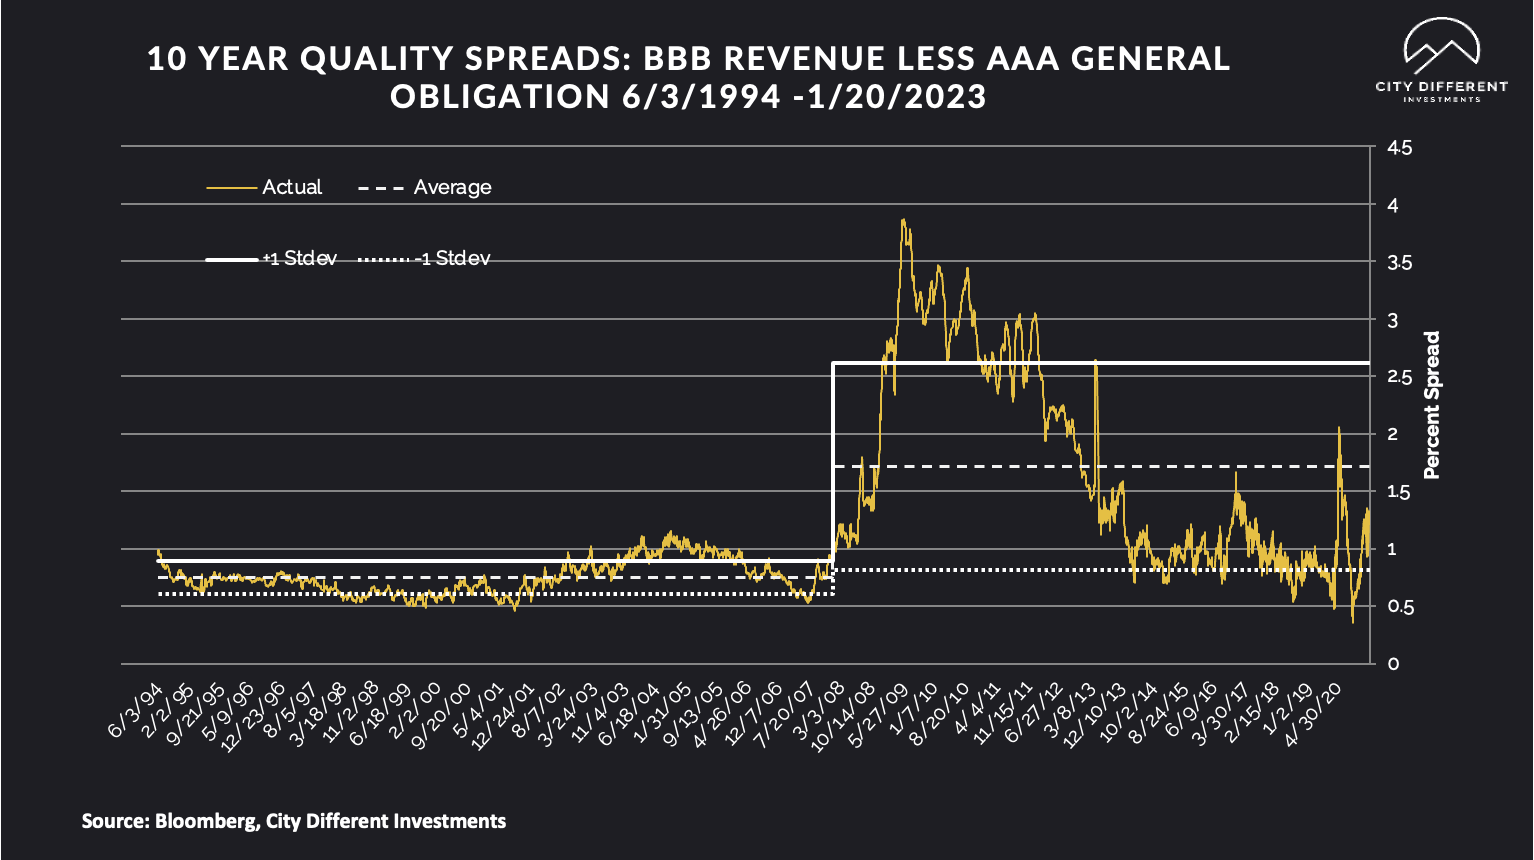
10-year quality spreads (AAA vs. BBB), as measured on January 20, were at 1.28%, three basis points lower than the January 13 reading of 1.31% and still below the long-term average of 1.72%.
The following graph is a new addition to our Weekly Commentary. It tracks taxable credit spreads. We track the yield to worst spread between the AAA and BBB components of the Bloomberg U.S. Aggregate Index. There can be some option-adjusted duration differences between the two indexes, and we will note those differences in the future.
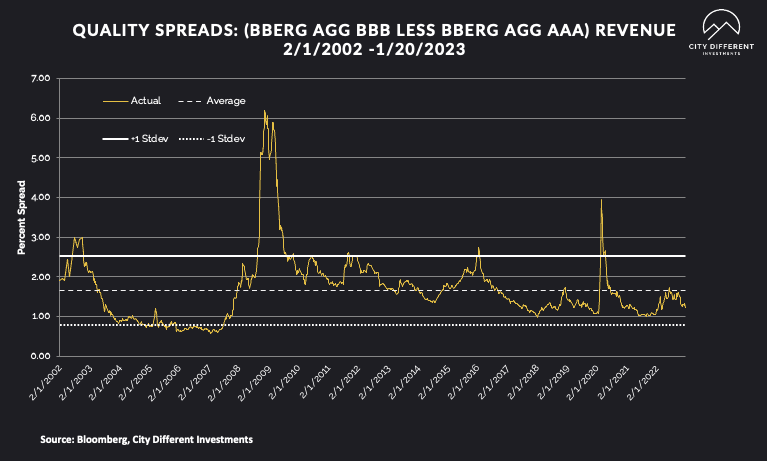
Both readings tell the same story; credit spreads are at the lower end of the fair range and not wide enough for CDI to take a strategic position. Given this week’s weak economic data, we feel these spreads are likely to widen in the future.
WHY IS THE MUNICIPAL MARKET BEHAVING THIS WAY?
Here we have made some additions that readers may find useful. We will be reporting cash flows into several fixed-income vehicles ranging from money market funds (since cash is no longer trash) to taxable and tax-exempt mutual funds and ETFs. The form will mostly be tabular. The source we have chosen to use is the Investment Company Institute (ICI). Rounding will impact some of the numbers.
Money Market Flows (millions of dollars)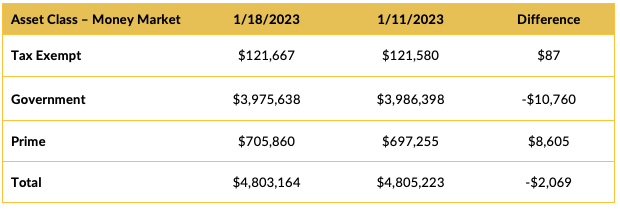 Source: Investment Company Institute (ICI)
Mutual Fund Flows (millions of dollars)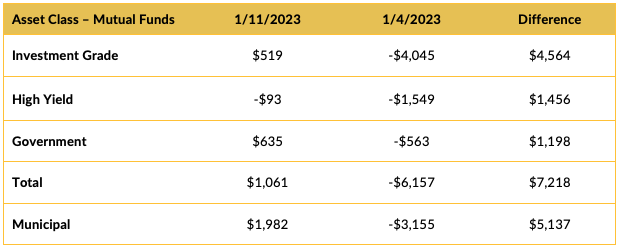
Source: Investment Company Institute (ICI)
ETF Fund Flows (millions of dollars)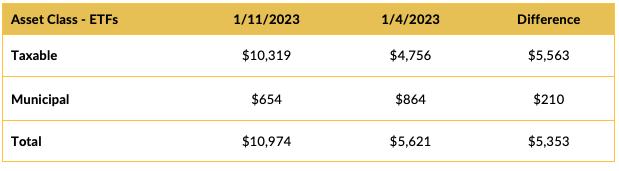 Source: Investment Company Institute (ICI)
In its Municipal Morning Intelligence newsletter dated January 20, 2023, JP Morgan commented on cash flow data, stating that:
- “Lipper reported combined weekly/monthly inflows of $1.5 billion. High Yield funds saw $823 million of inflows, Intermediate funds $185 million of inflows, and Long-Term funds saw $1.48 billion of inflows. Municipal ETFs registered $144 million of inflows.
- Over the past two weeks, open-end inflows have been broad based with 63% of complexes with inflows, totaling $2.9 billion. Long-term funds received $3.1 billion and HY received $1.8 billion, while intermediate and short funds had ~$0.2 billion outflows.
- In 2022, all term munis (X-ETFs) had outflows of $148 billion, or 15% of starting AUM. High Yield ($21 billion) lost 13% of AUM, and Long Term ($76 billion) lost 12% of AUM. Muni ETFs registered $26 billion of inflows (32% of AUM).
- Looking at the mutual fund outflows by fund complex (X-ETFs), fund outflows in 2022 were concentrated with 71% in about ten fund complexes, while HY fund outflows saw 73% from just the top five organizations.
- There was no linear relationship between 2022 fund complex total return performance and the amount of net outflows.”
SUPPLY OF NEW ISSUE MUNICIPAL BONDS
Expectations for new issuance are down from last week. According to JP Morgan:
“Next week we expect total supply of just $5.5 billion, or 79% of the 5-year equivalent week average ($7.0 billion). We anticipate tax-exempt supply of $4.9 billion (91% of average), and taxable/corp cusip supply of $653 million (39% of the average). With continued low supply and sizable investor capital on the sidelines, we believe that it would take a substantial and sustained sell-off in long UST rates to reverse the momentum in municipal fund flows and derail municipal market performance.”
Total new issuance supply figures of $10 billion or more usually indicate weakness in new issue supply pricing (higher yields).
CORPORATE INVESTMENT GRADE AND HIGH YIELD OVERVIEW
In its weekly "Credit Connection,” dated January 20, 2023, Wells Fargo commented:
“Recent declines in rates and equity vol. The long run story driving markets continues to be 1) too much inflation, 2) global central bank reaction and 3) recession. While the first part of that played out last year in the form of a rates shock this year’s theme is the last part — i.e. ultimately recession and corresponding credit spreads, which means decompression and significantly wider than current levels. However right now markets are in a vacuum in between, as softer inflation readings led to speculation the rate hiking cycle might soon be over while weakness in economic data until very recently was modest. As result both interest rate interest rate and equity vols declined the past couple of months, creating an ideal environment for risk assets and especially credit.
Credit vs. stocks. While risk assets have rallied note the recent decoupling between credit spreads and equities. Specifically, credit outperformed and is now generally rich to equities in the US, with the exception being EUR where credit appears cheap. We think credit outperformance in the US was driven by positive technicals due to yield-sensitive buying while EUR credit underperformance was driven by issuance."
CONCLUSION
The CDI Fixed Income team debated last week's data releases and concluded that, much like the market did, they showed economic weakness.
The problem is trying to reconcile those numbers with stronger-than-expected jobs numbers. Inflation is coming down but is still way above the Fed’s 2% target. The impact on inflation from China’s COVID policy about-face has yet to be seen. The long and short of this debate is that we could build a bull scenario and a bear scenario for future fixed income returns with just about equal conviction.
That said, the old saying about not fighting the Fed is ringing in our ears. We spent most of 2022 short duration compared to our midpoint neutral positioning. Given the uncertainty in the markets, we would expect to see our durations much closer to our midpoint neutral position for the start of 2023.
IMPORTANT DISCLOSURES
The information and statistics contained in this report have been obtained from sources we believe to be reliable but cannot be guaranteed. Any projections, market outlooks or estimates presented herein are forward-looking statements and are based upon certain assumptions. Other events that were not taken into account may occur and may significantly affect the returns or performance of these investments. Any projections, outlooks or assumptions should not be construed to be indicative of the actual events which will occur. These projections, market outlooks or estimates are subject to change without notice.
Please remember that past performance may not be indicative of future results. Different types of investments involve varying degrees of risk, and there can be no assurance that the future performance of any specific investment, investment strategy, or product or any non-investment related content, made reference to directly or indirectly herein will be profitable, equal any corresponding indicated historical performance level(s), be suitable for your portfolio or individual situation, or prove successful. Due to various factors, including changing market conditions and/or applicable laws, the content may no longer be reflective of current opinions or positions.
All indexes are unmanaged, and you cannot invest directly in an index. Index returns do not include fees or expenses. Actual portfolio returns may vary due to the timing of portfolio inception and/or investor-imposed restrictions or guidelines. Actual investor portfolio returns would be reduced by any applicable investment advisory fees and other expenses incurred in the management of an advisory account.
You should not assume that any discussion or information contained herein serves as the receipt of, or as a substitute for, personalized investment advice from City Different Investments. To the extent that a reader has any questions regarding the applicability above to his/her individual situation or any specific issue discussed, he/she is encouraged to consult with the professional advisor of his/her choosing. City Different Investments is neither a law firm nor a certified public accounting firm and no portion of this content should be construed as legal or accounting advice.
A copy of City Different Investments' current written disclosure statement discussing our advisory services and fees is available for review upon request.
Unless otherwise noted, City Different Investments is the source of information presented herein.
A description of the indices mentioned herein are available upon request.