
Preparing your Fixed Income Portfolio for Inflation
Should investors worry about inflation? We believe so.
Does that mean investors should abandon the fixed income markets? No.
A balanced portfolio made up of stocks and bonds has proven to be beneficial to investors over time. How should an investor manage their fixed income portfolio?
- Don’t panic. We have seen investors move en masse in periods of volatility (when rates increase and decrease). Have an investment plan for your long-term objectives that considers not only your objectives but also an honest evaluation of your tolerance for risk. Put another way, how much variation in the value of your investments can you psychologically tolerate? Do not stretch for yield, do not let the allure of extra income, albeit at higher relative prices, influence your investment plan.
- Stay short on the yield curve. Today the 1-5 Year range of both the Treasury and Municipal markets provide the best trade-off between risk and income.
- Be confident in your investment time horizon. Re-examine your time horizon to make sure you have not overestimated it. A 1–5-year laddered allocation to either market would have a duration of about 2.5 years. If rates increase, there would be an initial move down in Net Asset Value (value of the portfolio). But over the next 2.5 years that capital loss would be recovered as securities mature and those proceeds would be invested at higher rates, thus improving the investors’ dividend.
Are taxes going up? Probably, and that will impact the valuations of the municipal market, but the amount and timing of the increases are still an unknown. In our opinion the short end (1-5 years maturity range) of the fixed income markets currently provides the best tradeoffs between income (low) and risk (lower than longer maturity ranges).
How do you make the case for inflation? This has been a question I have been asking myself over the last year. Certainly, the pandemic has stymied economic activity and that is not inflationary, quite the opposite. However, we believe some of the effects of the pandemic and reactions to it have laid the foundation for future inflationary pressures. We lay out the case for inflation below.
What are the causes of inflation?
One definition is as follows, “Inflation means there is a sustained increase in the price level. The main causes of inflation are either excess aggregate demand (AD) (economic growth too fast) or cost push factors (supply-side factors).”
CAUSES OF INFLATION
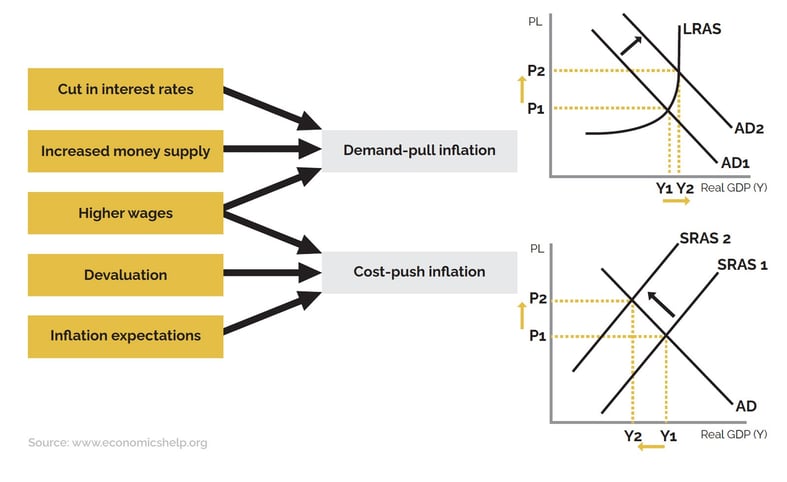
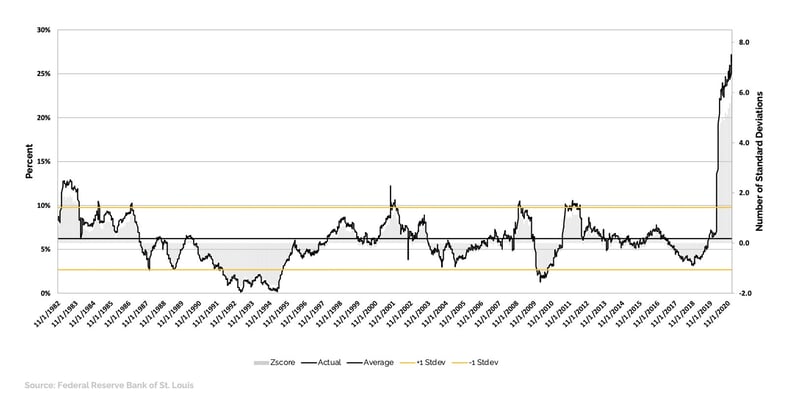
The above chart is a good visual representation of the inflation conundrum.Put another way, more money chasing few goods. I have been worried about the historic increase in money supply as measured by M2. The graph below illustrates the growth in M2 year-over-year since November 1982. As of January 25, 2021, M2 has grown at an annual rate of 26+%. For those so inclined that is almost a 6 standard deviation event (in a normal distribution 67% of all observations are between +/- 1 standard deviation). The annual growth rate of M2 is probably not a normal distribution but any 6 standard deviation event should raise the proverbial eyebrow.
YEAR OVER YEAR PERCENTAGE CHANGE IN M2 MONEY SUPPLY
 The growth of M2 is not the only driver of inflation. It is understandable why M2 has grown. The Federal Reserve, in an effort to combat the economic effects of the pandemic injected a great deal of liquidity into the market in March / April of 2020. Corporations and individuals also raised cash to bolster balance sheets to weather the pandemic. The other factor that is needed to drive inflation is an increase in “Velocity.” Velocity of M2 is defined as the frequency at which one unit of currency is used to purchase domestically produced goods and services within a given time period.
VELOCITY OF M2 MONEY SUPPLY
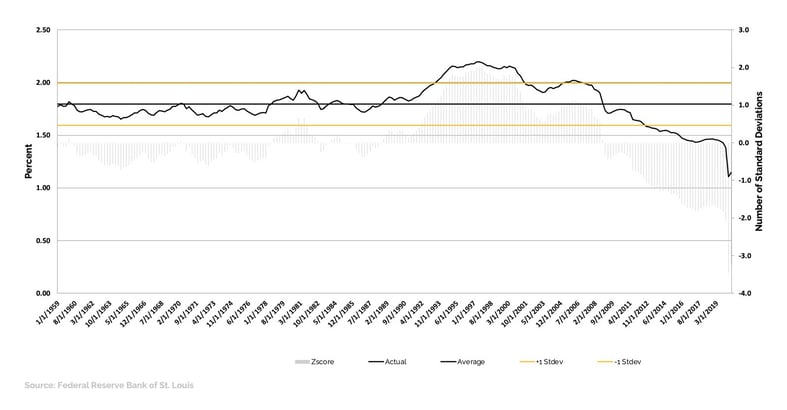 The above graph shows that the velocity of M2 dropped precipitously in the first part of 2020. This is not a surprise. What did all those corporations and individuals do with all the cash they raised? They sat on it. But as of 10/1/2020 (last observation available) the velocity of M2 increased, albeit slightly (3.3%).
Other Evidence
Here is additional evidence of inflationary pressures, some anecdotal, some not.
- When getting one of my cars serviced recently, I noticed that the dealership (we can skip for now the debate as to whether this is the optimal choice) had only two models on the showroom floor. I asked the person behind the desk why? The reply was that production delays have limited the number of available models.
- I ordered a replacement part for my dishwasher in mid-December and mid-January it had not arrived. I called the part provider and was informed that the part was not discontinued and that production backlogs brought on by the pandemic were the cause. No ETA could be provided.
- My wife and I purchased a new car in December 2020 and did not have a lot of negotiating power
Other evidence of inflation in the press
Wall Street Journal, January 2021 (glad they caught up):
“Manufacturing Rebound Has Suppliers Struggling to Keep Up, Rising demand means higher prices and long waits for steel, lumber and other materials needed by manufacturers.”
The Economist, January 2021:
“Supply bottlenecks are pushing up costs for manufacturers, when the virus first spread, they faced a collapse in demand.…and chip shortages are tightening the supply of new cars in America. Mr. Smoke expects prices of used vehicles to be 30% higher in April…”
Business Insider, August 2020:
“Prices for new and used cars are soaring as the COVID-19 pandemic skews supply and demand.”
USA Today,February 2021:
“Shoppers face shortages of cars, shirts and smart speakers amid COVID-19 shipping delays…COVID-19-related snags have delayed shipments of products and raw materials across the economy the past couple of months, pushing up wholesale costs and raising the likelihood of higher retail prices by midyear.”
What is the market saying?
-
5-Year, 5-Year Forward Inflation Expectation Rate. The following graph from the Federal Reserve Bank of St. Louis shows that the markets expectations of future inflation have increased from 0.86% on March 29, 2020 to 2.13% on February 8, 2021
5-YEAR, 5-YEAR FORWARD INFLATION EXPECTATION RATE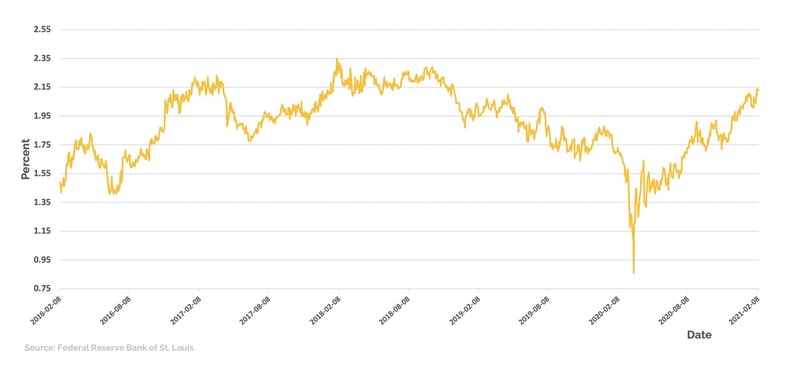
-
Corroborating this view is the steepening in the Treasury yield curve. Investors need to be paid to more to invest their dollars for a longer period of time.
TAXABLE YIELD CURVE
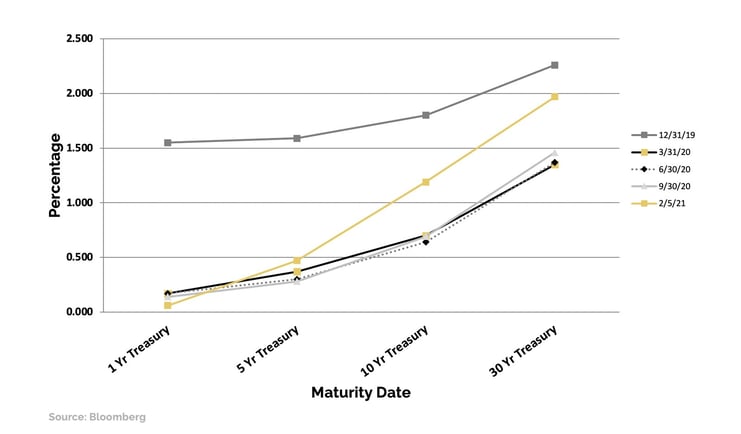
The above graph shows the slope of the Treasury curve, measured quarterly, since 12/31/2019. Rates are still low, but the curve is much steeper, meaning investors are demanding more income to invest their money for longer periods of time (good for bank’s net interest margin?).
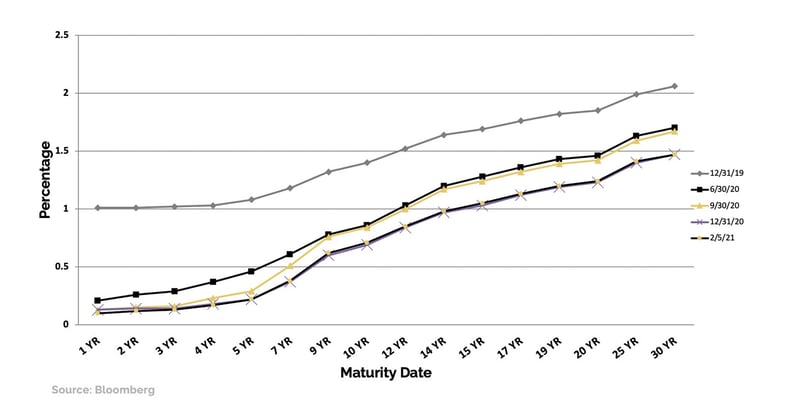
Do we see the same occurrence in the municipal market? The chart below suggests not. This could be driven by investor fear of increased taxes.
AAA GENERAL OBLIGATION MUNICIPAL YIELD CURVE
Are the Fixed Income markets pricing in the risk of raising inflation? N0!
The tables below show the real yield (yield less an inflation measure) for various segments of both the Treasury market and the Municipal market as of 12/31/2020.
Treasury Market
| Maturity | 12/31/20 Real Yield using Core PCE | Long Term Average | # of Standard Deviations Below Mean | Rich/Fair/Cheap Evaluation |
| 1 Year | -1.35 | 0.85 | -1.14 | Rich |
| 5 Year | 1.09 | 1.63 | -1.63 | Rich |
| 10 Year | -0.52 | 2.16 | -1.83 | Rich |
| 30 Year | 0.20 | 2.72 | -1.94 | Rich |
All the observations look rich at current core PCE levels (1.45%). If inflation expectations prove prescient, current evaluations are even richer. Shorter maturity Treasuries are relatively less rich than longer maturity Treasuries.
AAA General Obligation Municipal Market
| Maturity | 12/31/20 Real Yield using Core PCE | Long Term Average | # of Standard Deviations Below Mean | Rich/Fair/Cheap Evaluation |
| 1 Year | -1.32 | 0.16 | -1.15 | Rich |
| 5 Year | 1.23 | 1.92 | -1.77 | Rich |
| 10 Year | -0.76 | 1.66 | -2.18 | Rich |
| 30 Year | 0.02 | 2.55 | -2.33 | Rich |
Like the Treasury market, all the observations look rich at current core PCE levels (1.45%) and again, if inflation expectations prove prescient, current evaluations are even richer. Shorter maturity high grade municipals are relatively less rich than longer maturity high grade municipals.
Conclusion
This is where it pays to know your investment horizon, risk threshold and the important trade-offs between income and risk. To put it another way, stay short on the Municipal and Treasury yield curves.
IMPORTANT DISCLOSURES
The information and statistics contained in this communication have been obtained from sources we believe to be reliable but cannot be guaranteed. Any projections, market outlooks or forecasts discussed herein are forward-looking statements and are based upon certain assumptions. Other events that were not taken into account may occur and may significantly affect the returns or performance of these investments. Any projections, outlooks or assumptions should not be construed to be indicative of the actual events which will occur. These projections, market outlooks or estimates are subject to change without notice. Please remember that past performance may not be indicative of future results. Different types of investments involve varying degrees of risk, and there can be no assurance that the future performance of any specific investment, investment strategy, or product, or any non-investment related content, made reference to directly or indirectly in this communication will be profitable, equal any corresponding indicated historical performance level(s), be suitable for your portfolio or individual situation or prove successful. Due to various factors, including changing market conditions and/or applicable laws, the content may no longer be reflective of current opinions or positions. No discussion or information contained herein serves as the provision of, or as a substitute for, personalized investment advice. To the extent that a reader has any questions regarding the applicability above to his/her individual situation of any specific issue discussed, he/she is encouraged to consult with the professional advisor of his/her choosing. City Different Investments is neither a law firm nor a certified public accounting firm and no portion of this content should be construed as legal, tax, or accounting advice.