
In 2021, investors poured a record amount of cash into the municipal bond market, hoping to seek shelter from tax hikes expected as part of President Biden’s “Build Back Better” social spending and tax bill and the administration’s infrastructure bill. At this writing, politicians continue to wrangle with details of the proposed legislation, leaving the future of taxpayers hanging in the balance.
Rest assured, at City Different Investments, we are closely monitoring developments. But we would caution that higher taxes aren’t the only factor that municipal bond investors need to assess. In fact, we believe they’re not even the biggest risk. Yet, some muni bond investors seem to have gotten caught up in the tax-hike hype, losing sight of other potential risks.
We’ve outlined some of these risks in this blog post.
Credit Risk
| “The risk that an entity may not meets its contractual, financial obligations as they come due and any estimated financial loss in the event of default. Credit ratings do not address any other risk, including but not limited to: liquidity risk, market value risk, or price volatility.” – Moodys.com |
According to a Moody’s report, “US Municipal Bond Defaults and Recoveries, 1970–2019,” actual default risk for muni bonds has remained consistently low. Over the 50-year period covered in the study, the cumulative default rate for municipal bonds was 0.16% compared to a 10.17% default rate for global corporate bond markets. It’s no wonder investors regard municipal bonds as a low-risk hedge against rising taxes.
But default isn’t the only way an investor can face a loss in value. There are other risks to weigh, most notably market value risk.
Consider yield spreads—the incremental yield a particular security offers over some benchmark. An investor who purchases a security at a given spread may be well compensated for the credit risk they are taking on. However, if the yield spread widens, the investor will experience a loss in relative value, making the credit risk no longer worth carrying. Conversely, if the spread narrows, the investor will reap a gain in relative value.
.png)
The timespan in the above chart reveals what happened to the yield spread over the long run. As you can see, the spread increased significantly around the Great Recession. Prior to this period, insured municipal bonds represented more than 50% of new issuance volume. Following the financial crisis, most municipal bond insurers lost their AAA ratings and consequently a significant amount of relative value. Today, municipal bond insurance still represents less than 10% of the new issue market. Trust, once lost, is hard to regain.
Notably, the narrowest spread since 1994 was 0.354% on 8/31/2021. As of 12/31/21, that spread was 0.631%. Compared to the long-term average for this relationship of 1.73%, spreads today are quite thin.
We don’t think investors should shy away from risk, but they should look to be well compensated for the risk they are taking on. In our opinion, investors currently are not being compensated for taking on additional credit risk and should seek to maintain a neutral to underweighted position relative to this risk factor (dependent on overall strategy positioning).
Duration Risk
| “The risk associated with the sensitivity of a bond's price to a one percent change in interest rates. The higher a bond's duration, the greater its sensitivity to interest rates changes.” – The Financial Industry Regulatory Authority (FINRA) |
In a deceasing interest rate environment, higher duration provides more income and capital appreciation—the two components of total return. However, in a rising rate environment, this increase in income would be offset by capital losses, making lower duration more appealing.
How should investors determine whether to own more or less duration risk? One way is to view the current interest rate environment within the context of fixed income investors’ major nemesis—inflation, which eats away at their purchasing power. To measure this impact, we apply the concept of “real yield,” which is calculated by subtracting the rate of inflation from the current interest rate on a fixed income security.
Take a look at the below table, which shows the relationship between inflation, as measured by the Core Personal Consumption Expenditure (CPE) Price Index—the Fed’s favorite inflation gauge—and real yields. In this example, we show the impact across the maturity spectrum of a generic AAA tax-exempt general obligation bond. While the Fed’s accommodative fiscal policy was undeniably the right policy response to fight the pandemic, a subsequent steep rise in inflation has driven real yields to extremely low levels.
High Inflation, Low Real Yield
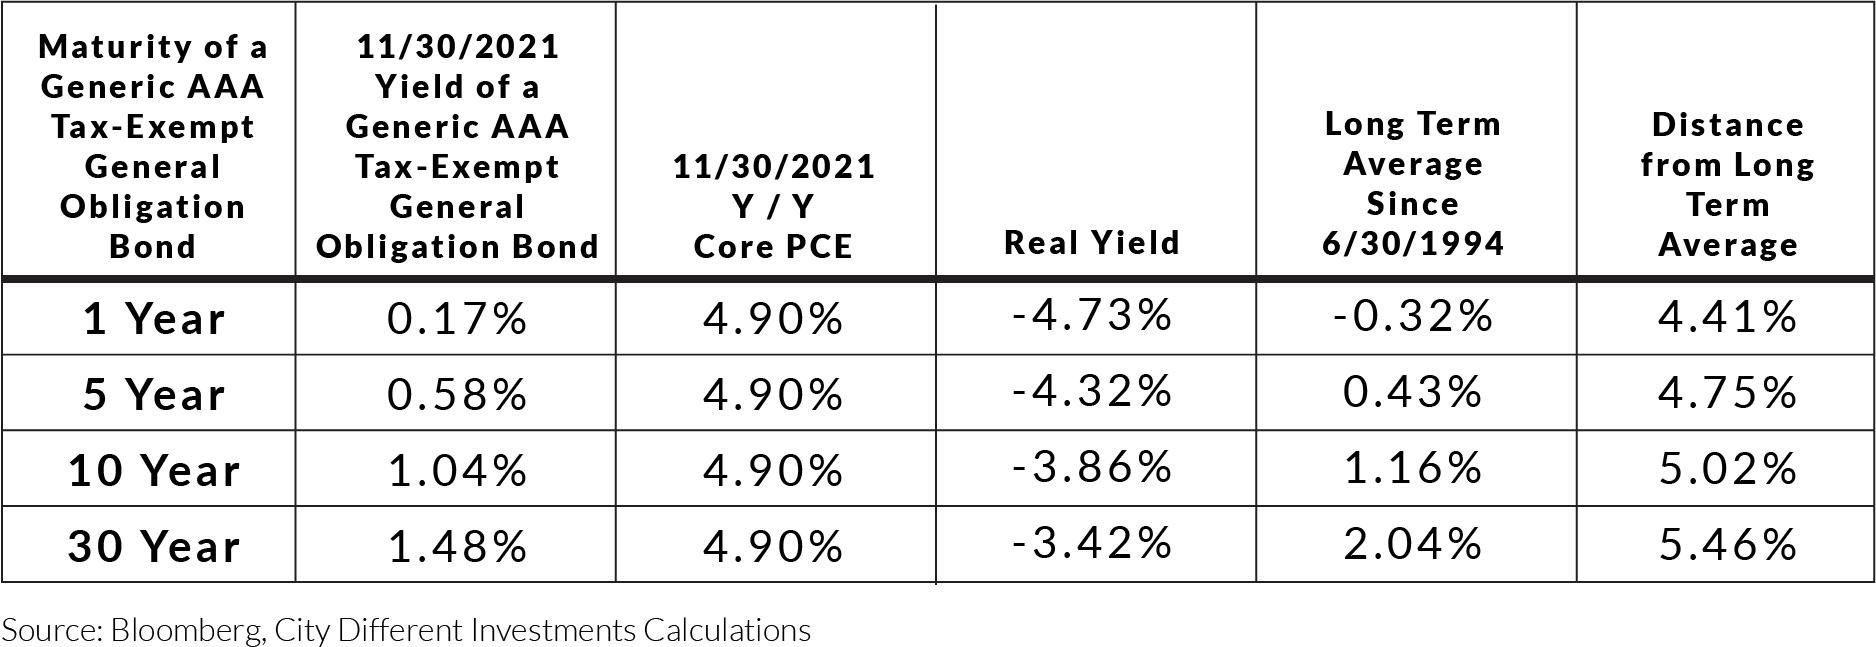
This table shows that, although shorter maturity securities have lower real yields, they are in fact farther off their long-term averages, and therefore less expensive relative to longer term securities. Coupled with the fact that longer-term maturities have higher durations than shorter-term maturity securities, this observation suggests that, by our estimates, longer-term issues currently represent the relatively riskiest set of securities in the muni market.
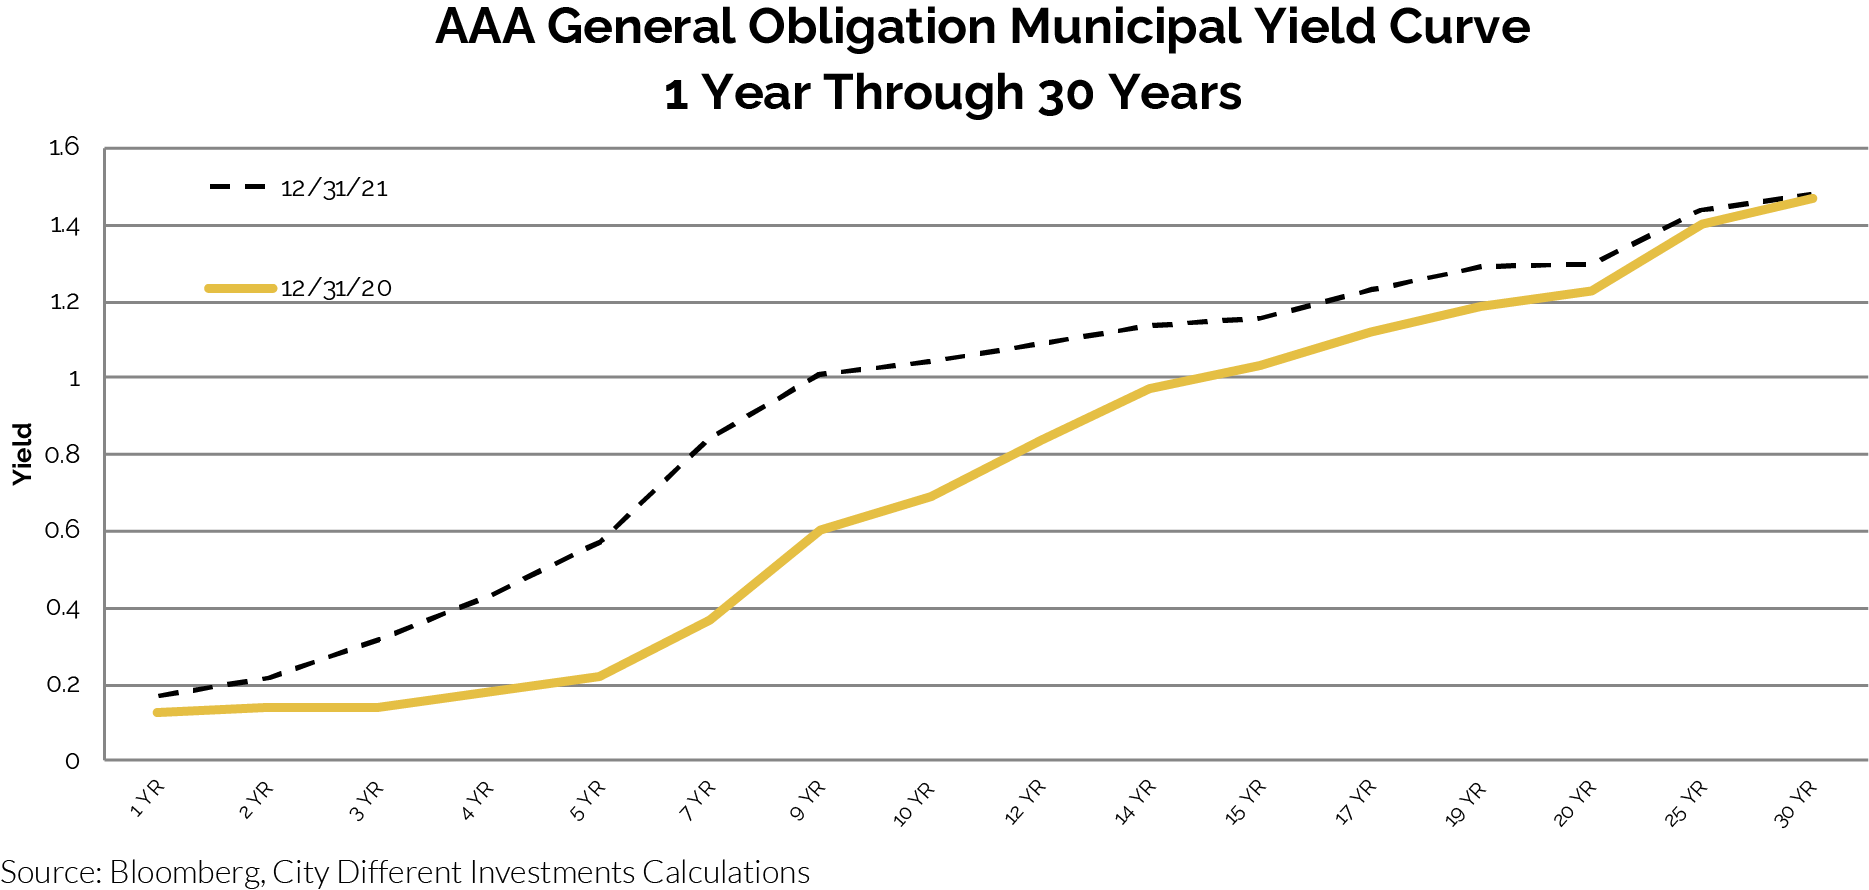
In addition, the yield curve is not exceptionally steep, which is to say that investors are not gaining a lot of additional yield potential by buying longer versus shorter maturity securities.
In short, current yields aren’t paying investors for added duration risk.
Yield Curve Risk
| “The risk of experiencing an adverse shift in market interest rates associated with investing in a fixed income instrument. When market yields change, this will impact the price of a fixed-income instrument. When market interest rates, or yields, increase, the price of a bond will decrease, and vice versa.” – Investopedia.com |
Importantly, yield changes are not uniform across the entire maturity spectrum, as the chart below illustrates. With this in mind, investors may want to consider hedging yield curve risk by structuring their portfolio as a “ladder.” A laddered portfolio is comprised of bonds with staggered or varying maturities so that when a particular bond matures, proceeds from the investment can then be rolled into longer-dated bonds.
While there are other fixed income portfolio structures that can also help mitigate yield curve risk, our calculations indicate that laddered structures have outperformed these alternatives the majority of the time. They also generally tend to be more tax efficient, meaning they often incur less capital gain tax liability.
Look Beyond the Headlines
Tax increases aren’t the only factors that matter in buying municipal bonds. In fact, they’re not even the most important consideration. There are multiple risks to consider, and excessive demand for tax-exempt issues is only making the problems worse.
At City Different Investments, we believe a wise approach to investing in municipal bonds is to avoid rich areas of the market, stick with good values, construct your portfolio wisely, and stop making every decision based on the latest news from the Capitol.
For more on the subject of risks to consider when investing in municipal bonds, we invite you to read our thought piece, “Six Risks Investors Overlook – and One They Overhype,” which provides a deeper dive and our unique perspective on the topic.
IMPORTANT DISCLOSURES
The information and statistics contained in this communication have been obtained from sources we believe to be reliable but cannot be guaranteed. Any projections, market outlooks or forecasts discussed herein are forward-looking statements and are based upon certain assumptions. Other events that were not taken into account may occur and may significantly affect the returns or performance of these investments. Any projections, outlooks or assumptions should not be construed to be indicative of the actual events which will occur. These projections, market outlooks or estimates are subject to change without notice. Please remember that past performance may not be indicative of future results. Different types of investments involve varying degrees of risk, and there can be no assurance that the future performance of any specific investment, investment strategy, or product, or any non-investment related content, made reference to directly or indirectly in this communication will be profitable, equal any corresponding indicated historical performance level(s), be suitable for your portfolio or individual situation or prove successful. Due to various factors, including changing market conditions and/or applicable laws, the content may no longer be reflective of current opinions or positions. No discussion or information contained herein serves as the provision of, or as a substitute for, personalized investment advice. To the extent that a reader has any questions regarding the applicability above to his/her individual situation of any specific issue discussed, he/she is encouraged to consult with the professional advisor of his/her choosing. City Different Investments is neither a law firm nor a certified public accounting firm and no portion of this content should be construed as legal, tax, or accounting advice.