.png)

WEEK ENDING 1/23/2026
- Ugly American in Davos
- Economy looks healthy
- New Fed chair on the horizon
- What an interconnected world we live in
A CITY DIFFERENT TAKE
Though we had some interesting economic releases this week, Davos took center stage. The risk of a Greenland (or Iceland) invasion seemed to escalate:
“‘What do you make of what's going on with the president in Greenland? And now he's slapped tariffs on eight of our allies in Europe; he's not ruling out military force to get Greenland. What is going on?’ ‘This Week’ co-anchor Jonathan Karl asked McCaul, who serves as chairman emeritus of both the House Foreign Affairs and Homeland Security committees.” Greenland or Iceland
The U.S. financial markets did not take the escalation lightly. After the MLK holiday, the S&P 500 Index closed Tuesday down 143 points (versus Friday’s close down -2.06%). It did recover most of those losses by week’s end. The bond market did not fare much better. The 10-year Treasury note finished Tuesday up 0.07% higher in yield versus Friday’s close. It also recovered most of those losses by Friday. What drove these reactions?
“Trump ruled out the use of force to take Greenland and backed off his threat to impose stinging tariffs on several European countries. He later said he had reached a framework for a deal with NATO to decide the territory’s future.” Anybody order TACOs?
Thank goodness we have a “framework of a future deal.” Greenland or Iceland
Soon the President’s anger was focused on our neighbor to the north (and, one might add, a major trading partner):
“President Trump threatened a major escalation in a brewing trade war against Canadian Prime Minister Mark Carney’s government, warning that the U.S. would impose 100% tariffs on all Canadian goods and products coming into the U.S. if ‘Canada makes a deal with China." Gloves Off!
Let’s just set the stage:
Goods Exports
“The United States is the second largest goods exporter in the world, behind only China. U.S. goods exports to the world totaled $2.1 trillion in 2022, up 17.5% ($307.3 billion) from 2021. Canada was the largest purchaser of U.S. goods exports in 2022, accounting for 17.3% of total U.S. goods exports. The top five purchasers of U.S. goods exports in 2022 were: Canada ($356.5 billion), Mexico ($324.3 billion), China ($150.4 billion), Japan ($80.2 billion), and the United Kingdom ($76.2 billion). U.S. goods exports to the EU were $350.8 billion.”
Goods Imports
“The United States is the largest goods importer in the world. U.S. goods imports from the world totaled $3.2 trillion in 2022, up 14.6% ($413.7 billion) from 2021. China was the top supplier of goods to the United States, accounting for 16.5% of total goods imports. The top five suppliers of U.S. goods imports in 2022 were: China ($536.3 billion), Mexico ($454.8 billion), Canada ($436.6 billion), Japan ($148.1 billion), and Germany ($146.6 billion). U.S. goods imports from the EU were $553.3 billion.” Set the Stage
Is this good policy? We don’t know, but it seems like poor business to “piss off” your largest customer. Why don’t we ask a U.S. soybean farmer?
“An agriculture economist at Ohio State University says ongoing trade uncertainty with China continues to create volatility for U.S. soybean farmers.
“‘It looks like they’re already starting to book new crop soybeans from Brazil,’ he says. ‘I think China is going to continue to diversify where it gets its imports from.’” Farming is a tough life, let’s make it tougher.
Here’s an AI overview from Google of how much U.S. debt is owned by foreign governments:
“As of late 2024, foreign governments and investors held approximately $8.5 trillion in U.S. Treasury securities, accounting for roughly 23–24% of the total outstanding U.S. federal debt. Japan remained the largest foreign holder with over $1 trillion, followed by Mainland China.
Key Foreign Holders in 2024:
- Total Foreign Holdings:~$8.5–$8.6 trillion (as of Dec. 2024)
- Japan:~$1.06–$1.1 trillion
- China:~$759 billion
- United Kingdom:~$690–$723 billion
- Luxembourg:~$373 billion
- Canada:~$328 billion
“While the dollar amount of foreign holdings has grown, the overall share of U.S. debt held by foreign entities has generally declined over the past decade because the total supply of U.S. debt has increased at a faster rate.”
More specifically the same AI overview yielded the following results about the EU:
“As of January 2026, European investors and institutions hold approximately $2 trillion to $3.6 trillion in U.S. Treasury debt, representing nearly 40% of all U.S. public debt held by foreign entities. The EU is the largest foreign financier of U.S. borrowing, with major holdings concentrated in countries like Belgium, Luxembourg, and France.
The Wall Street Journal published an article last week titled “Americans Are the Ones Paying for the Tariffs, Study Finds”
“By analyzing $4 trillion of shipments between January 2024 and November 2025, the Kiel Institute researchers found that foreign exporters absorbed only about 4% of the burden of last year’s U.S. tariff increases by lowering their prices, while American consumers and importers absorbed 96%.
“The German research echoes recent reports by the Budget Lab at Yale and economists at Harvard Business School, finding that only a small fraction of the tariff costs were being borne by foreign producers.” Who Pays? We Pay!
If that is not enough proof, Amazon’s Any Jassy has this to say from Davos:
“‘So you start to see some of the tariffs creep into some of the prices, some of the items,’ he said. ‘Some sellers are deciding that they’re passing on those higher costs to consumers in the form of higher prices, some are deciding that they’ll absorb it to drive demand, and some are doing something in between.’” Mr. Jassy Speaks
Now for the economic releases. Q3 GDP came in at 4.4% versus an estimate of 4.3% and a prior reading of 4.3%. As of Jan. 22, the Atlanta Fed estimates Q4 GDP will be 5.4%. Good Times?
October (2.7%) and November (2.8%) year-over-year Core PCE was released. Inflation still looks sticky and above the Fed’s 2.0% target. Speaking of the Fed, they meet next on Jan. 28 and the probability of a 0.25% rate cut is only 2.8%. The market implied probability increases to 41.7% at the June 17 meeting which is the first meeting under a new chair. The Forbes headline “New Fed Chair Pick Expected In Days”:
“President Trump is expected to nominate a new Federal Reserve chair within days. BlackRock’s Rick Rieder has surged as the current favorite according to prediction markets. Having decades of investment experience, Rieder’s nomination may calm financial markets after Trump’s repeated attacks on the Fed. Those attacks include attempts to fire Fed Governor Lisa Cook and recent legal threats that caused Jerome Powell and other prominent bankers, to publicly defend the Fed’s independence.” Good Luck Mr. Rieder
TreasuryMarket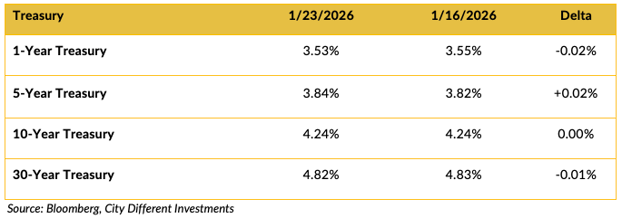
The Treasury yields hit the skids on Tuesday as the risk of military action against Denmark seemed to increase. That pressure was relieved after the president backed off his inflammatory pronouncements. A Danish pension fund plans to sell all its holdings of U.S. Treasury securities:
“A Danish pension fund is planning to sell its entire holdings of U.S. Treasuries — about $100 million — over concerns about the U.S. government's financial stability.” Sell, Sell, Sell! to steal from CNBC's Jim Cramer
Is this the first shoe to drop? As a debtor nation, why anger our creditors? Would you “piss off” your mortgage holder (if you could figure out who that is)?
Add to that, Japan’s prime minister stoked a little volatility to the U.S. bond market:
“Japanese government bond yields surged after Prime Minister Takaichi proposed a consumption-tax waiver, signaling investor concern over increased borrowing.” What an Interconnected World We Live In!
The fear hitting the U.S. bond market is that if Japanese interest rates increase enough to tempt Japanese investors to sell foreign securities and repatriate those assets into domestic securities, thereby putting more pressure on U.S. interest rates.
The 2/10 spread remained close to unchanged as last week at 64 basis points for the period.
Municipal Market
Municipal yields reacted to world events just like other fixed-income markets with added pressure brought on by high new-issue supply. This supply increase is usually not seen until later in the new year. The 2/10 slope steepened to 41 basis points, 6 basis points higher than the week before. (The long-term average is 1.49%.)
Selected Municipal AAA General Obligation Bond / Selected Treasury Bonds Yield Ratio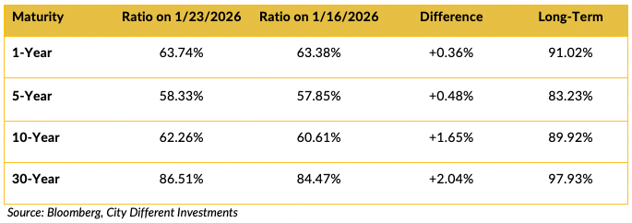
Treasury-muni ratios are higher across the board due to the municipal markets’ reaction to world events and supply pressures.
Investment Grade Corporates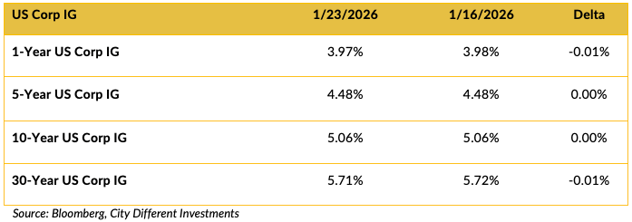
Investment-grade corporate bond yields were unchanged for the week.
THIS WEEK IN WASHINGTON

This week, the focus is off Washington and on Minnesota. Another Minneapolis resident, Alex Pretti, a U.S. citizen, lost his life at the hands of ICE agents.
AP reported that the Fourth Amendment to the Constitution, which protects the American public from unreasonable searches and seizures by the government, is being questioned:
“Federal immigration officers are asserting sweeping power to forcibly enter people's homes without a judge's warrant, according to an internal Immigration and Customs Enforcement memo obtained by The Associated Press, marking a sharp reversal of longstanding guidance meant to respect constitutional limits on government searches.” Search and Seizure?
“‘Absent an emergency, absent consent by the homeowner, that is a violation of a person's Fourth Amendment rights, and they can sue,’ Farrell said.” so much for that right
These are interesting times we find ourselves in.
WHAT, ME WORRY ABOUT INFLATION?
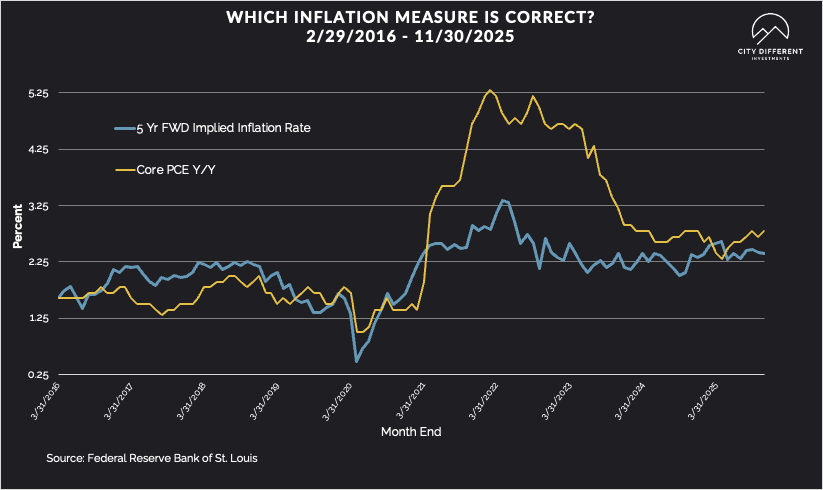
The 5-year Breakeven Inflation Rate finished the week of Jan. 26 at 2.46%, 7 basis points higher than last week. The 10-year Breakeven Inflation Rate finished the period at 2.32%, 1 basis point lower than last week.
MUNICIPAL CREDIT
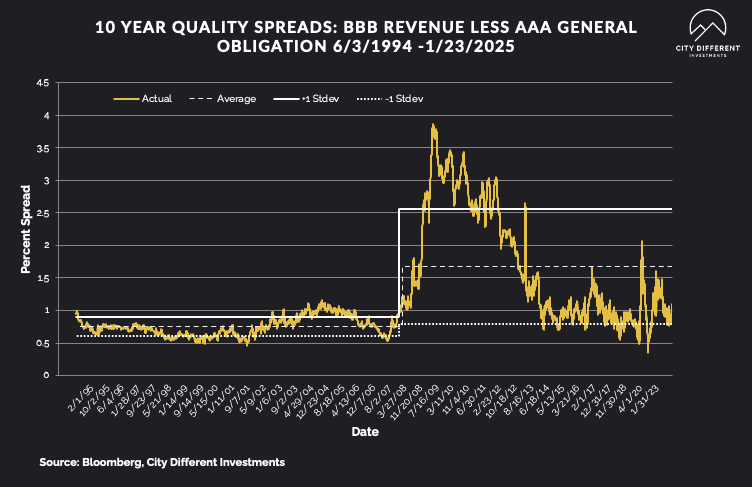
Last week's 10-year quality credit spread stayed stagnant week over week between BBB revenue bonds and AAA general obligation bonds at 1.01%. The historical average credit spread is at 1.68%.
TAXABLE CREDIT
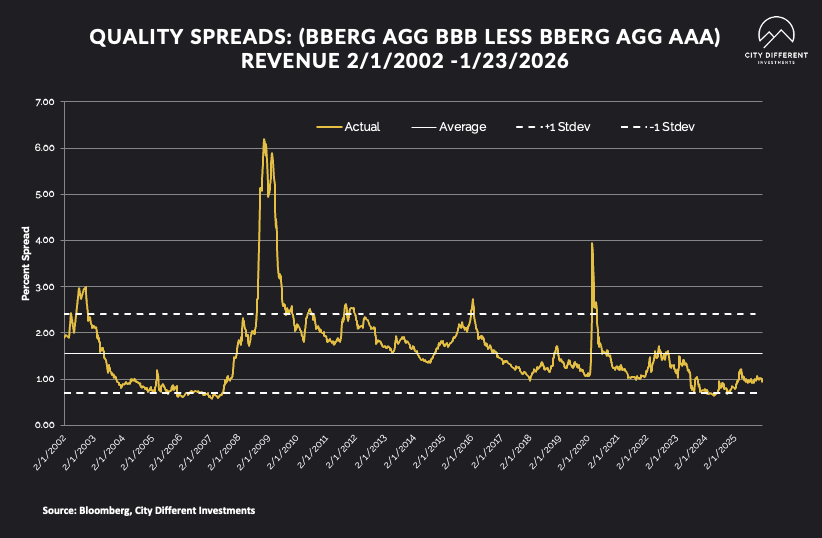
Investment-grade spreads are tight at 94 basis points this week. The long-term average is 1.56%.
WHERE ARE FIXED-INCOME INVESTORS PUTTING THEIR CASH?
Money Market Flows (millions of dollars)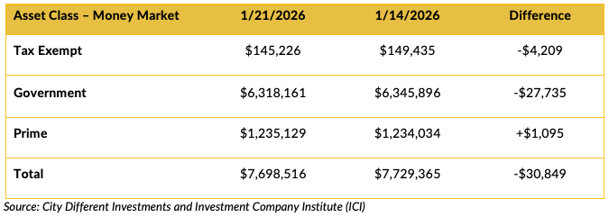
Money market fund flows were negative except for prime funds.
Mutual Fund Flows (millions of dollars)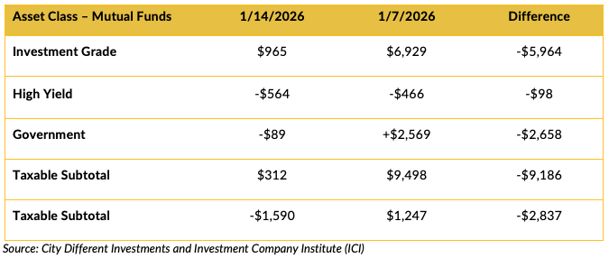
Mutual fund flows in total were down week over week.
ETF Fund Flows (millions of dollars)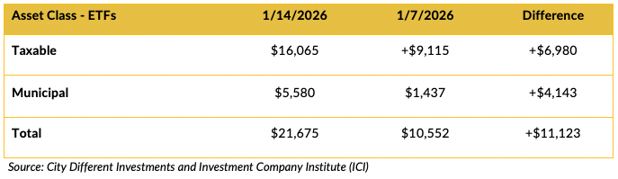
Net ETF flows were positive week over week.
SUPPLY OF NEW ISSUE BONDS
This week’s supply is light at $2.5 billion in tax-exempt markets.
CONCLUSION
The economy seems to be finishing 2025 on a strong note. The employment picture is weakening, creating 50,000 non-farm payroll jobs as of the last reading (versus a long-term average of 157,000), which Chair Powell thinks is enough to maintain current unemployment levels. The latest inflation looks sticky, and the tariff effect looks like it is beginning to be seen in consumer prices. These factors make the Fed’s job even more difficult. But it will be the new Fed Chief’s problem in June. The market implied odds of a short-term rate cut are low until a pickup in June.
IMPORTANT DISCLOSURES
The information and statistics contained in this report have been obtained from sources we believe to be reliable but cannot be guaranteed. Any projections, market outlooks or estimates presented herein are forward-looking statements and are based upon certain assumptions. Other events that were not taken into account may occur and may significantly affect the returns or performance of these investments. Any projections, outlooks or assumptions should not be construed to be indicative of the actual events which will occur. These projections, market outlooks or estimates are subject to change without notice.
Please remember that past performance may not be indicative of future results. Different types of investments involve varying degrees of risk, and there can be no assurance that the future performance of any specific investment, investment strategy, or product or any non-investment related content, made reference to directly or indirectly herein will be profitable, equal any corresponding indicated historical performance level(s), be suitable for your portfolio or individual situation, or prove successful. Due to various factors, including changing market conditions and/or applicable laws, the content may no longer be reflective of current opinions or positions.
All indexes are unmanaged, and you cannot invest directly in an index. Index returns do not include fees or expenses. Actual portfolio returns may vary due to the timing of portfolio inception and/or investor-imposed restrictions or guidelines. Actual investor portfolio returns would be reduced by any applicable investment advisory fees and other expenses incurred in the management of an advisory account.
You should not assume that any discussion or information contained herein serves as the receipt of, or as a substitute for, personalized investment advice from City Different Investments. To the extent that a reader has any questions regarding the applicability above to his/her individual situation or any specific issue discussed, he/she is encouraged to consult with the professional advisor of his/her choosing. City Different Investments is neither a law firm nor a certified public accounting firm and no portion of this content should be construed as legal or accounting advice.
A copy of City Different Investments' current written disclosure statement discussing our advisory services and fees is available for review upon request.
Unless otherwise noted, City Different Investments is the source of information presented herein.
A description of the indices mentioned herein is available upon request.